

 ambcrypto.com
Chiliz [$CHZ] extended its decline over the past 24 hours, falling 11.41% to $0.02127 as selling pressure intensified, while trading volume rose 25.46% to $67.13 million.
The sharp rise in activity suggested that traders remained highly engaged despite the continued weakness in price action.
Market participation increased as volatility expanded, yet buyers failed to establish meaningful support.
Instead, the token continued printing lower highs and lower lows, reinforcing the bearish structure that had developed over recent weeks.
Rising volume alongside falling prices often reflects aggressive distribution, and recent market activity aligned with that pattern.
Why are Spot traders still selling?
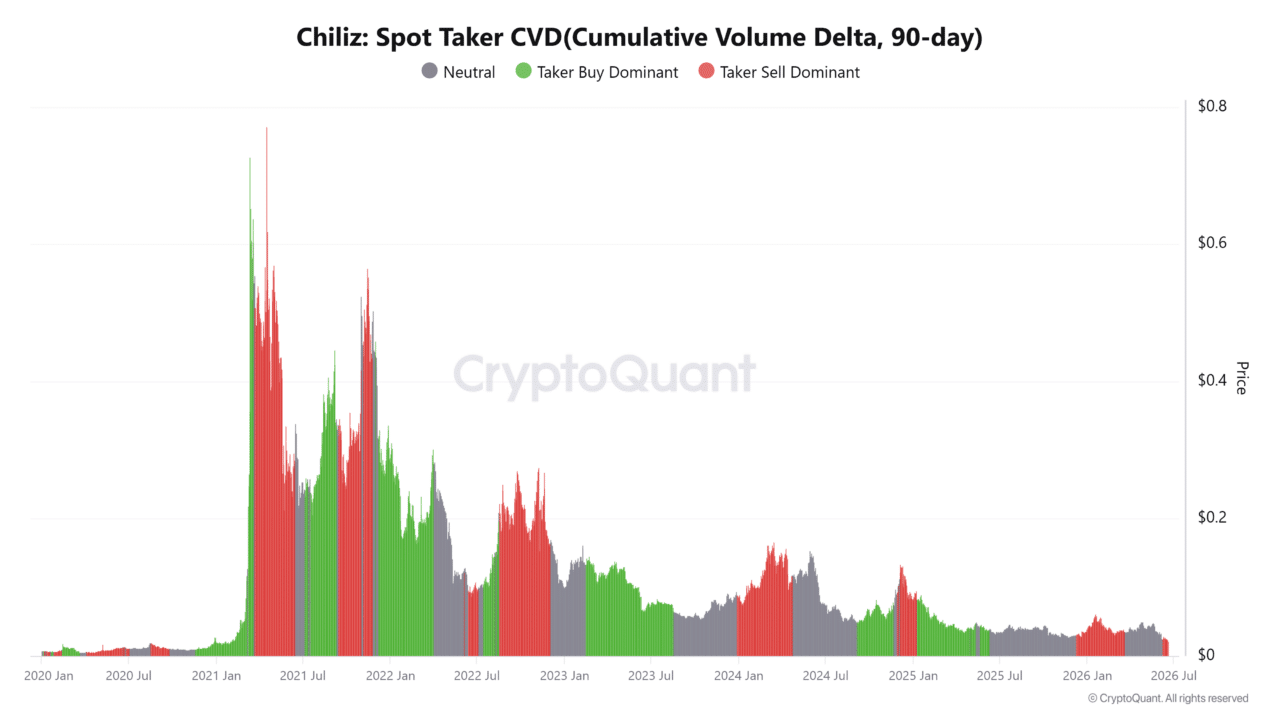
Spot market data continued highlighting persistent selling activity despite the surge in overall trading participation. The 90-day Spot Taker CVD remained seller-dominant, indicating that aggressive market orders largely favored exits rather than accumulation.
This trend suggested that market participants had continued accepting lower prices to close positions.
While occasional buying interest emerged during intraday rebounds, it failed to outweigh the broader wave of sell-side pressure. Such behavior often reflects weak conviction among spot buyers, particularly during prolonged downtrends.
 Source: CryptoQuant
$CHZ neared key support as RSI weakened
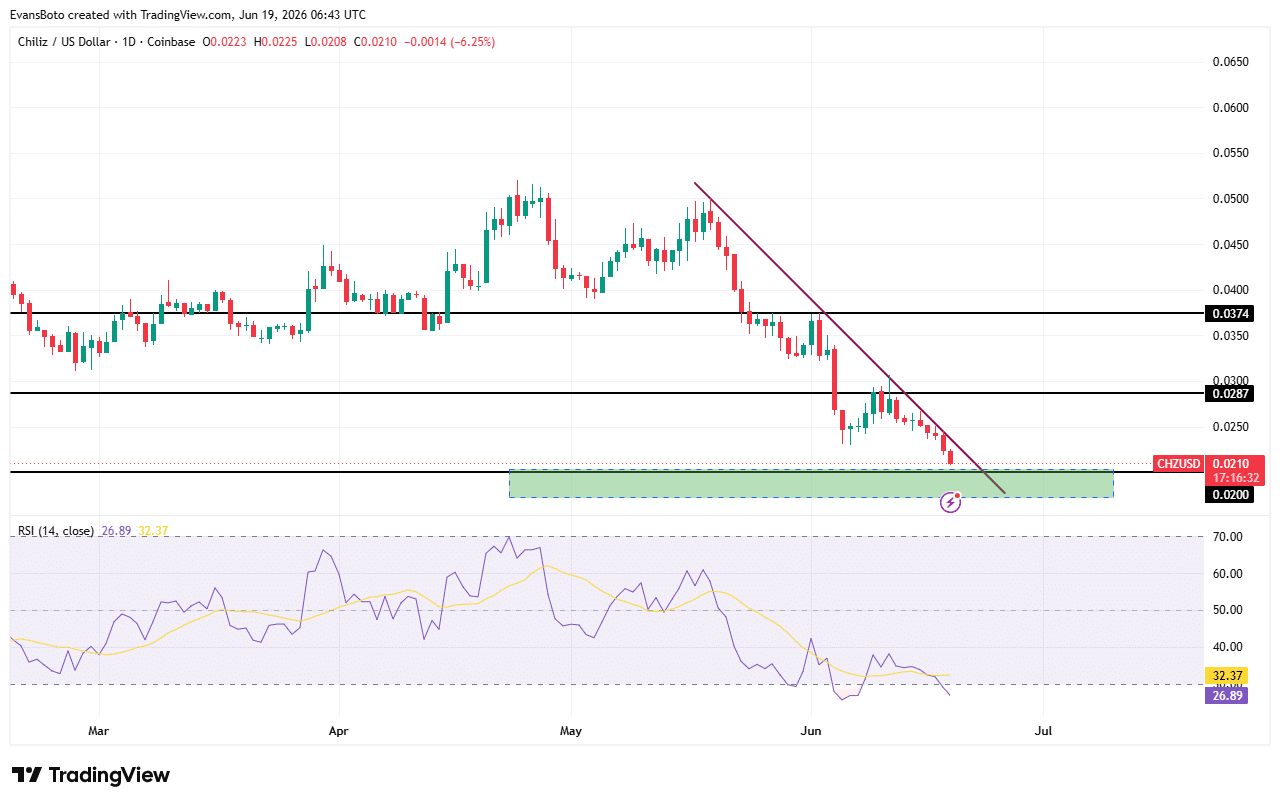
Looking at the daily chart, Chiliz [$CHZ] price approached a critical demand zone after losing several important support levels during the broader decline.
$CHZ traded near the $0.020 area after previously falling below the $0.0287 and $0.0374 levels, both of which had supported price action earlier in the year.
The daily chart showed a well-defined descending trendline that continued rejecting upside attempts. Meanwhile, the Relative Strength Index dropped to 26.89, placing the indicator in oversold territory.
Such readings often reflect intense selling pressure, although they can also precede short-term relief rallies when demand begins returning.
Even so, the broader structure remained bearish because the price continued trading beneath the descending resistance trendline.
If buyers defend the current demand zone, $CHZ could attempt a rebound toward the $0.0287 resistance area. However, a decisive loss of $0.020 could expose the asset to deeper downside pressure.
 Source: TradingView
Funding Rates revealed growing bearish conviction
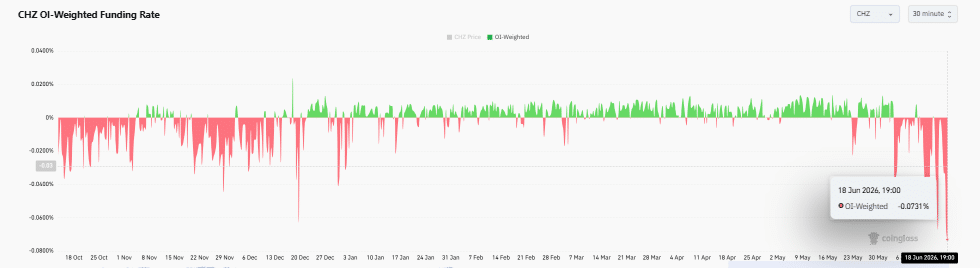
Derivatives traders increasingly positioned for additional downside as sentiment deteriorated across futures markets. $CHZ’s OI-Weighted Funding Rate fell sharply into negative territory and reached approximately -0.0731% at the time of writing.
Negative Funding Rates generally indicate that short sellers have paid long traders to maintain their positions.
In this case, the decline reflected stronger bearish positioning as traders anticipated further weakness. The indicator had remained mostly positive during earlier months before reversing sharply lower in recent sessions.
That shift highlighted a notable deterioration in market sentiment and suggested that traders had increasingly favored downside exposure.
While heavily negative Funding Rates can occasionally create conditions for short squeezes, current positioning primarily reflected expectations of continued weakness.
As long as funding remains deeply negative, bearish sentiment could continue influencing price behavior.
 Source: CoinGlass
The $0.020 demand zone now represents the most important level on the chart. If buyers successfully defend this area, $CHZ could attempt a recovery toward higher resistance levels.
However, if selling pressure persists and the support zone breaks, the downtrend could continue toward lower price levels.
Final Summary
- Spot sellers continued dominating activity despite rising trading volume and participation.
- Negative Funding Rates and oversold RSI reflected growing bearish sentiment.





