Bitget App
Trade smarter
Buy cryptoMarketsTradeFuturesStocksEarnInstitutionAI & More
Here’s the Target as XRP Eyes Right-Angled Descending Broadening Trend Breakout

Here’s the Target as XRP Eyes Right-Angled Descending Broadening Trend Breakout

CryptoNewsNetCryptoNewsNet2026/10/05 15:09
By:CryptoNewsNet
Back to the list

Here’s the Target as XRP Eyes Right-Angled Descending Broadening Trend Breakout

Here’s the Target as XRP Eyes Right-Angled Descending Broadening Trend Breakout image 0  thecryptobasic.com 11 m
Here’s the Target as XRP Eyes Right-Angled Descending Broadening Trend Breakout image 1

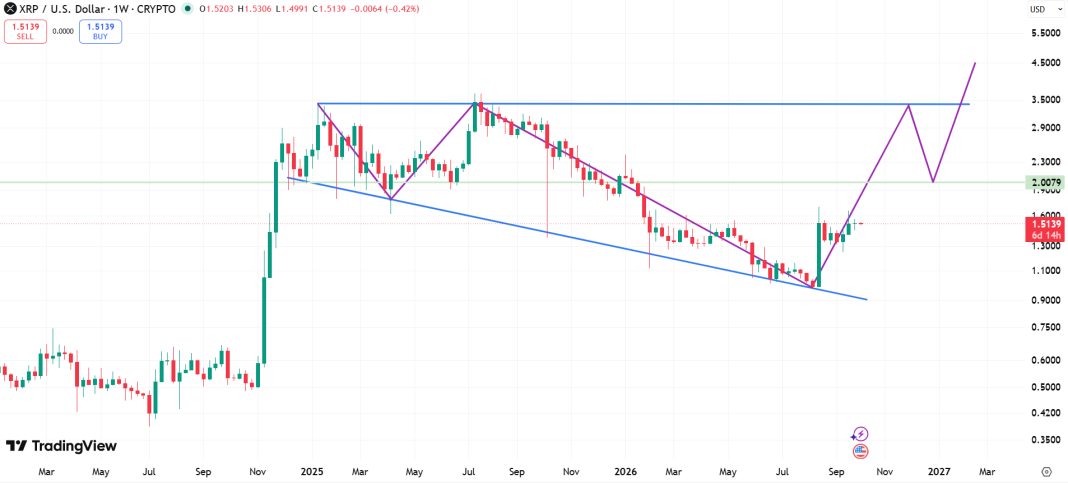
$XRP is now looking to break above a right-angled descending broadening formation after spending much of 2025 and 2026 in this structure.

The recovery that started on Aug. 19 has put $XRP on a possible path toward a breakout above the pattern. However, the token still has a long way to go before it reaches the upper trendline.

If the current recovery continues, $XRP could eventually test that level and set up a move toward a much higher price target.

$XRP Forms Right-Angled Descending Broadening Pattern

For the uninitiated, a right-angled descending broadening formation has two trendlines that move farther apart, creating a widening price channel.

The upper trendline stays flat and acts as resistance, while the lower trendline moves downward as price records a series of lower lows. Despite the falling lower trendline, this pattern has a bullish bias when it forms during a downtrend.

$XRP started forming the structure after its impressive November 2024 rally, which came as optimism grew around Donald Trump’s election victory. Specifically, the price rose from $0.50 in November 2024 to an initial high of $3.40 by January 2025. This top matched the flat upper trendline of the formation.

$XRP then dropped to $1.60 by April 2025, marking its first test of the falling lower trendline. Buyers stepped in at this level and pushed $XRP back toward the upper boundary. The recovery eventually took the token to a new all-time high of $3.66.

However, the resistance around this level matched the upper trendline and stopped the growth. $XRP then entered a prolonged decline, falling from around $3.00 to $0.98 by August 2026, a drop of roughly 67%, leading to a retest of the lower trendline. This second test further confirmed the formation.
Here’s the Target as XRP Eyes Right-Angled Descending Broadening Trend Breakout image 2 $XRP Right Angled Descending Broadening Formation

$XRP’s Path to the Upper Trendline

After $XRP tested the lower trendline at $0.98, the token began the ongoing recovery and has since climbed to $1.51, a gain of more than 54% from the August 2026 low. The rebound shows that buyers again stepped in around the lower boundary, which supports the bullish case for the pattern.

However, $XRP is still way below the upper trendline. This level sits near $3.50, meaning $XRP would need to rise another 131% from $1.51 just to reach the area where a breakout attempt could take place.

Previous price action also suggests that $XRP could face another pullback before reaching $3.50, which could give buyers time to consolidate before making another attempt to break through the resistance.

The Breakout Target

If $XRP breaks above the $3.50 upper trendline and confirms the bullish resolution of the pattern, the measured move leads to a target near $6.00.

This target comes from an evaluation of the widest part of the formation. Specifically, the distance between the upper trendline at $3.50 and the lowest low at $0.98 is $2.52. Adding that $2.52 range to the $3.50 breakout level gives a target of around $6.00.

A move to $6.00 would give $XRP a new all-time high and put the token nearly 70% above the $3.50 upper trendline. However, $XRP would first need to maintain its recovery, build enough momentum, and overcome the resistance level that has already rejected the price twice.

0
0

Disclaimer: The content of this article solely reflects the author's opinion and does not represent the platform in any capacity. This article is not intended to serve as a reference for making investment decisions.

Understand the market, then trade.
Bitget offers one-stop trading for cryptocurrencies, stocks, and gold.
Trade now!

You may also like

Federal Reserve and European Central Bank Expected to Pause Together, But Why Are Global Funds Still Cautious? Former JPMorgan Analyst Predicts: Ongoing Rate Hike Pressure Still Suppresses Stocks and Bonds

According to the latest research report released by JPMorgan, the core trading clues in financial markets associated with this week's monetary policy decisions by central banks in Europe, the United States, and Japan are centered around whether, after announcing a pause in interest rate hikes in October as widely expected by the market, these central banks will continue to maintain a strong tightening stance in their policies.

智通财经•2026/10/26 04:16
Federal Reserve and European Central Bank Expected to Pause Together, But Why Are Global Funds Still Cautious? Former JPMorgan Analyst Predicts: Ongoing Rate Hike Pressure Still Suppresses Stocks and Bonds

SK Hynix responds to "16 trillion won special dividend report": Shareholder return measures to be announced on Wednesday

The funds, totaling approximately 20 trillion KRW in net profits from the sale of Kioxia shares, are expected to be returned at a rate of about 80%. Previously, the company had pledged to use over 50% of its free cash flow from 2025 to 2027 for shareholder returns, and had suspended the US IPO plan for its subsidiary Solidigm, drawing significant attention to its capital allocation strategy.

华尔街见闻•2026/10/26 03:56

Earnings Preview | After a 30% Drop in Stock Price, Will HBM4 Mass Production and DRAM Price Increases Reignite SK Hynix (SKHY.US) Rally?

SK Hynix will announce its financial results for the third quarter of fiscal year 2026 on October 28.

智通财经•2026/10/26 03:47
Earnings Preview | After a 30% Drop in Stock Price, Will HBM4 Mass Production and DRAM Price Increases Reignite SK Hynix (SKHY.US) Rally?