
JPMorgan: Risks in the U.S. Stock Market—Leverage Is Back

Hello everyone, this is You Dou.
After the market rises, it's easy for people to change their assessment of risk.
Right after a correction, everyone cares about minimizing their losses. When the market regains its strength, concerns shift to: Is my position too light? Should I buy back the stocks I sold earlier? Should I add some leverage to make up for the missed gains?
On September 30, JPMorgan released a “Flows & Liquidity” report, with a subtitle “Equity vulnerabilities”.Weaknesses in the Stock Market.
This report discusses an issue that is easily masked by market rallies: after the deleveraging in June and July, some positions and leverage have returned. Moreover, some leverage may have never really retreated significantly in the first place.
After reading this, what concerns me most is why these two things can happen at the same time.
Who truly deleveraged in June and July?
At the end of July, JPMorgan believed that the deleveraging process that began in June was progressing faster than expected, and the previous excessive accumulation in stock positions and leverage had largely been digested.
But two months later, they found that some overheating indicators had resurfaced.
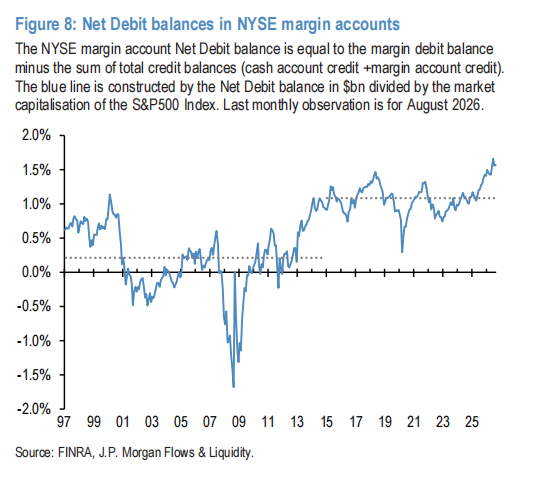
One thing worth noting is margin trading accounts.
The report uses the net margin loan balance of margin accounts, relative to the total market capitalization of the S&P 500, to observe the leverage situation among U.S. individual investors. This methodology deducts credit balances in the accounts, so it cannot be directly equated with the total margin debt figures commonly seen in news reports.
As of August, this indicator remains at a very high level.JPMorgan believes that the deleveraging in June and July had almost no significant impact on the leverage in margin accounts.
To be more accurate: these accounts include both individuals and institutions. JPMorgan judges that most of them may be individual investors, thus using this as a proxy for individual investor leverage. It is not a survey tallying each retail account one by one.
But the difference it signals is clear:The market has gone through a round of deleveraging, but this does not mean every type of participant has reduced their leverage.
Some funds have adjusted their risk exposure, while others remain with high borrowing within the market. Looking at index changes alone makes it hard to see this distinction.
Withdrawn funds are also increasing positions again.
While the leverage in margin accounts hasn't declined significantly, on the other hand, some institutional risk exposure is starting to rise again.
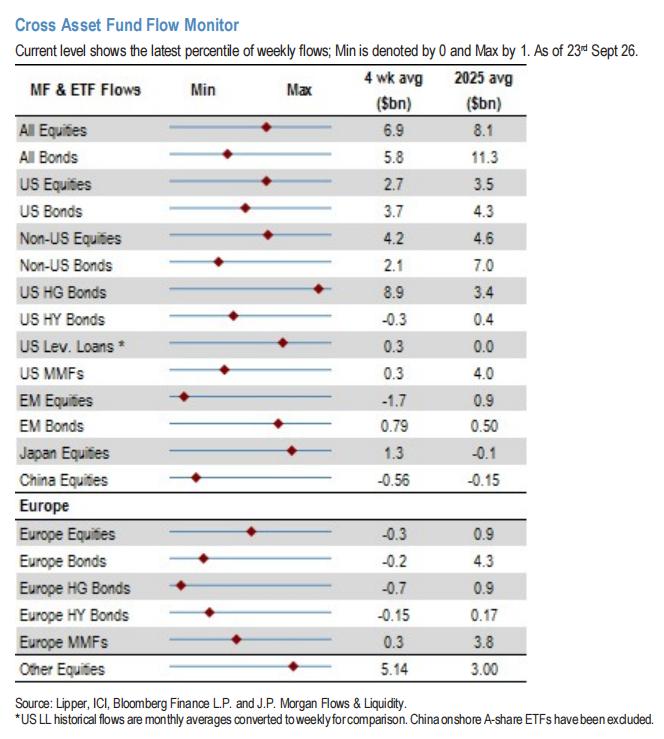
The report shows that the combined position indicator for asset management firms and leveraged funds in U.S. equity futures has rebounded close to annual highs.
Broader composite indicators of equity positions also returned to near previous highs in September. However, JPMorgan also pointed out that this composite indicator may have peaked in September. “Back to high levels” does not necessarily mean that all funds keep adding to their positions.
Trend-following funds have also shown similar changes. According to JPMorgan’s momentum signals, CTAs and other trend-following traders may have started to rebuild long positions in Nasdaq and certain Asian tech-related indices, but the scale is still far below previous extreme levels.
Leveraged ETFs offer another observation angle.
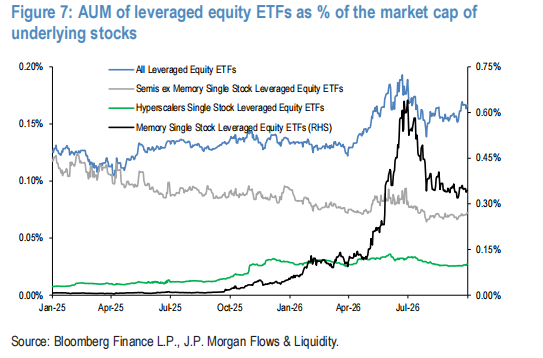
The report tracks the asset size of leveraged equity ETFs in proportion to the market capitalization of their underlying stocks. After bottoming out at the end of July, this indicator has risen again in recent weeks, returning to about 70% of its range from the April low to the June high.
This 70% refers to its position within that range and does not mean leveraged ETFs account for 70% of the entire market.
JPMorgan is concerned that if this ratio continues to rise, leveraged ETFs could once again become sources of deleveraging and abnormal volatility.
Connecting all these clues, the market structure becomes clearer: some funds always maintain high leverage, while other funds increase their risk exposure again after adjustment. However, JPMorgan generally believes that the overheating in positions and leverage this time is still less than that in June and July.
In my understanding, this makes the market more sensitive to volatility. If different types of funds need to shrink exposure simultaneously, the reason for selling may not come from company fundamentals, but from their respective risk limits.
The driving force behind the rally also has its limit.
The report also mentions short covering.
At the beginning of September, the ratio of shorted SPY shares to the float fell to historic lows, and has since seemed to bottom out. Semiconductor ETFs like SMH and DRAM, which previously had higher short interest, have also normalized.
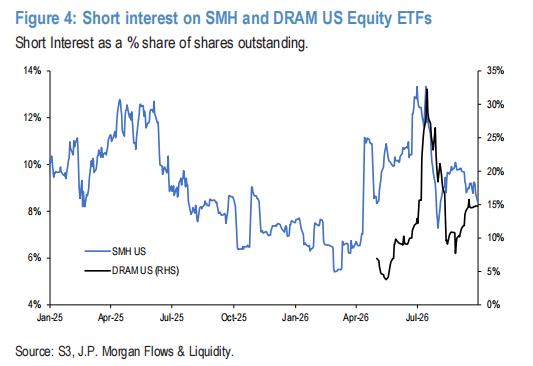
Based on this, JPMorgan judges that the upward push previously fueled by short covering has largely played out.
When short sellers close positions, they need to buy back securities. This type of buying can drive prices up, but doesn't necessarily indicate that new capital is reassessing long-term value.
As covering gradually completes, the market will need other sources of buying to take over.
Of course, this does not prove the market is about to fall, and a low short interest ratio is not a direct signal for predicting a top. It merely reminds us that a force that previously drove the rally may not continue at the same strength.
With these hidden risks, why is JPMorgan still bullish on tech?
This is also what makes the report worth reading.
While warning about risks in positions and leverage, JPMorgan still believes that tech and AI-related industries have fundamental support.
They list three reasons.
First, storage prices are still trending upward, providing support for storage manufacturers.
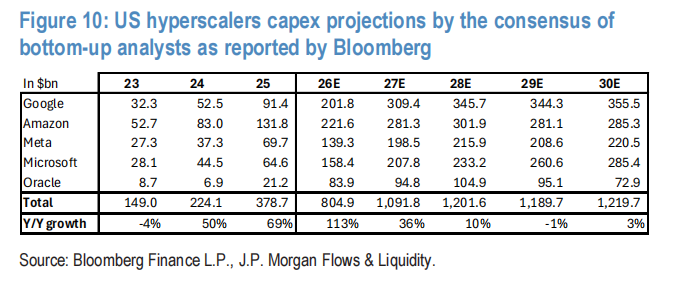
Second, analysts are steadily raising capex forecasts for large cloud vendors. The report tallied five companies — Google, Amazon, Meta, Microsoft, and Oracle: For 2026, total forecasts rose from about $758 billion on July 1 to about $805 billion; for 2027, from about $925 billion to about $1.1 trillion.
These numbers are capex forecasts by analysts, not confirmed spending commitments by the companies, nor are they all purely AI expenditure. Nevertheless, they illustrate that market expectations for basic infrastructure investment continue to rise.
Third, computational power pricing, as represented by Nvidia Hopper-series GPU rental prices, has recently shown some improvement. JPMorgan believes this helps to support the monetization prospects of AI capex, and also challenges some investors' fears that equipment will rapidly become obsolete and depreciate too quickly.
Therefore, their judgment is that even if there is another wave of risk contraction like in June and July, it may not break the tech bull market.
This judgment belongs to JPMorgan; it is not a guarantee of future market moves.
For me, the most valuable takeaway from this report is to look at corporate fundamentals and market positioning together.
AI demand can keep growing, and related companies can keep increasing investment; at the same time, stock prices could undergo significant volatility due to crowded positioning or leverage contraction.
Both business progress and how much volatility the funds holding it can withstand will affect pricing.
If you equate a rally with “risk has disappeared,” you'll easily overlook this side of the story.
As we enter Q4, what this report inspires me to ask when looking at a market rally is: besides asking what’s happening with companies, one must also ask how market participants are holding these assets.
Which funds are using leverage? Which positions are near their highs? If volatility surges, which buyers might turn into sellers?
These questions may not help us guess the exact date of the next correction but can help us understand why a fundamentally supported rally can suddenly become hard to hold onto.
Believing in a company’s future and bearing the volatility during the holding period are both things that deserve serious consideration.
Disclaimer: The content of this article solely reflects the author's opinion and does not represent the platform in any capacity. This article is not intended to serve as a reference for making investment decisions.
You may also like
XRP ETF Demand Rises as Institutional Inflows Grow
Nasdaq Futures Long Positioning Hits 50% of Open Interest — Highest Since 2017

S&P 500 First Half of October Is Q4’s Strongest Half-Month in Midterm Years

U.S. September corporate layoffs hit a four-year low for the same period, but hiring intentions fell to the lowest level in fifteen years for the same period
According to a report by Challenger, Gray & Christmas, the number of layoffs announced by U.S. companies in September fell by nearly 20% year-on-year, while layoffs in technology companies increased by 77% month-on-month. The number of planned hirings in September by companies dropped 23% year-on-year. On the same day, the number of initial jobless claims in the U.S. last week fell to 197,000, approaching the lowest level since 1969.

Crypto prices
More


