

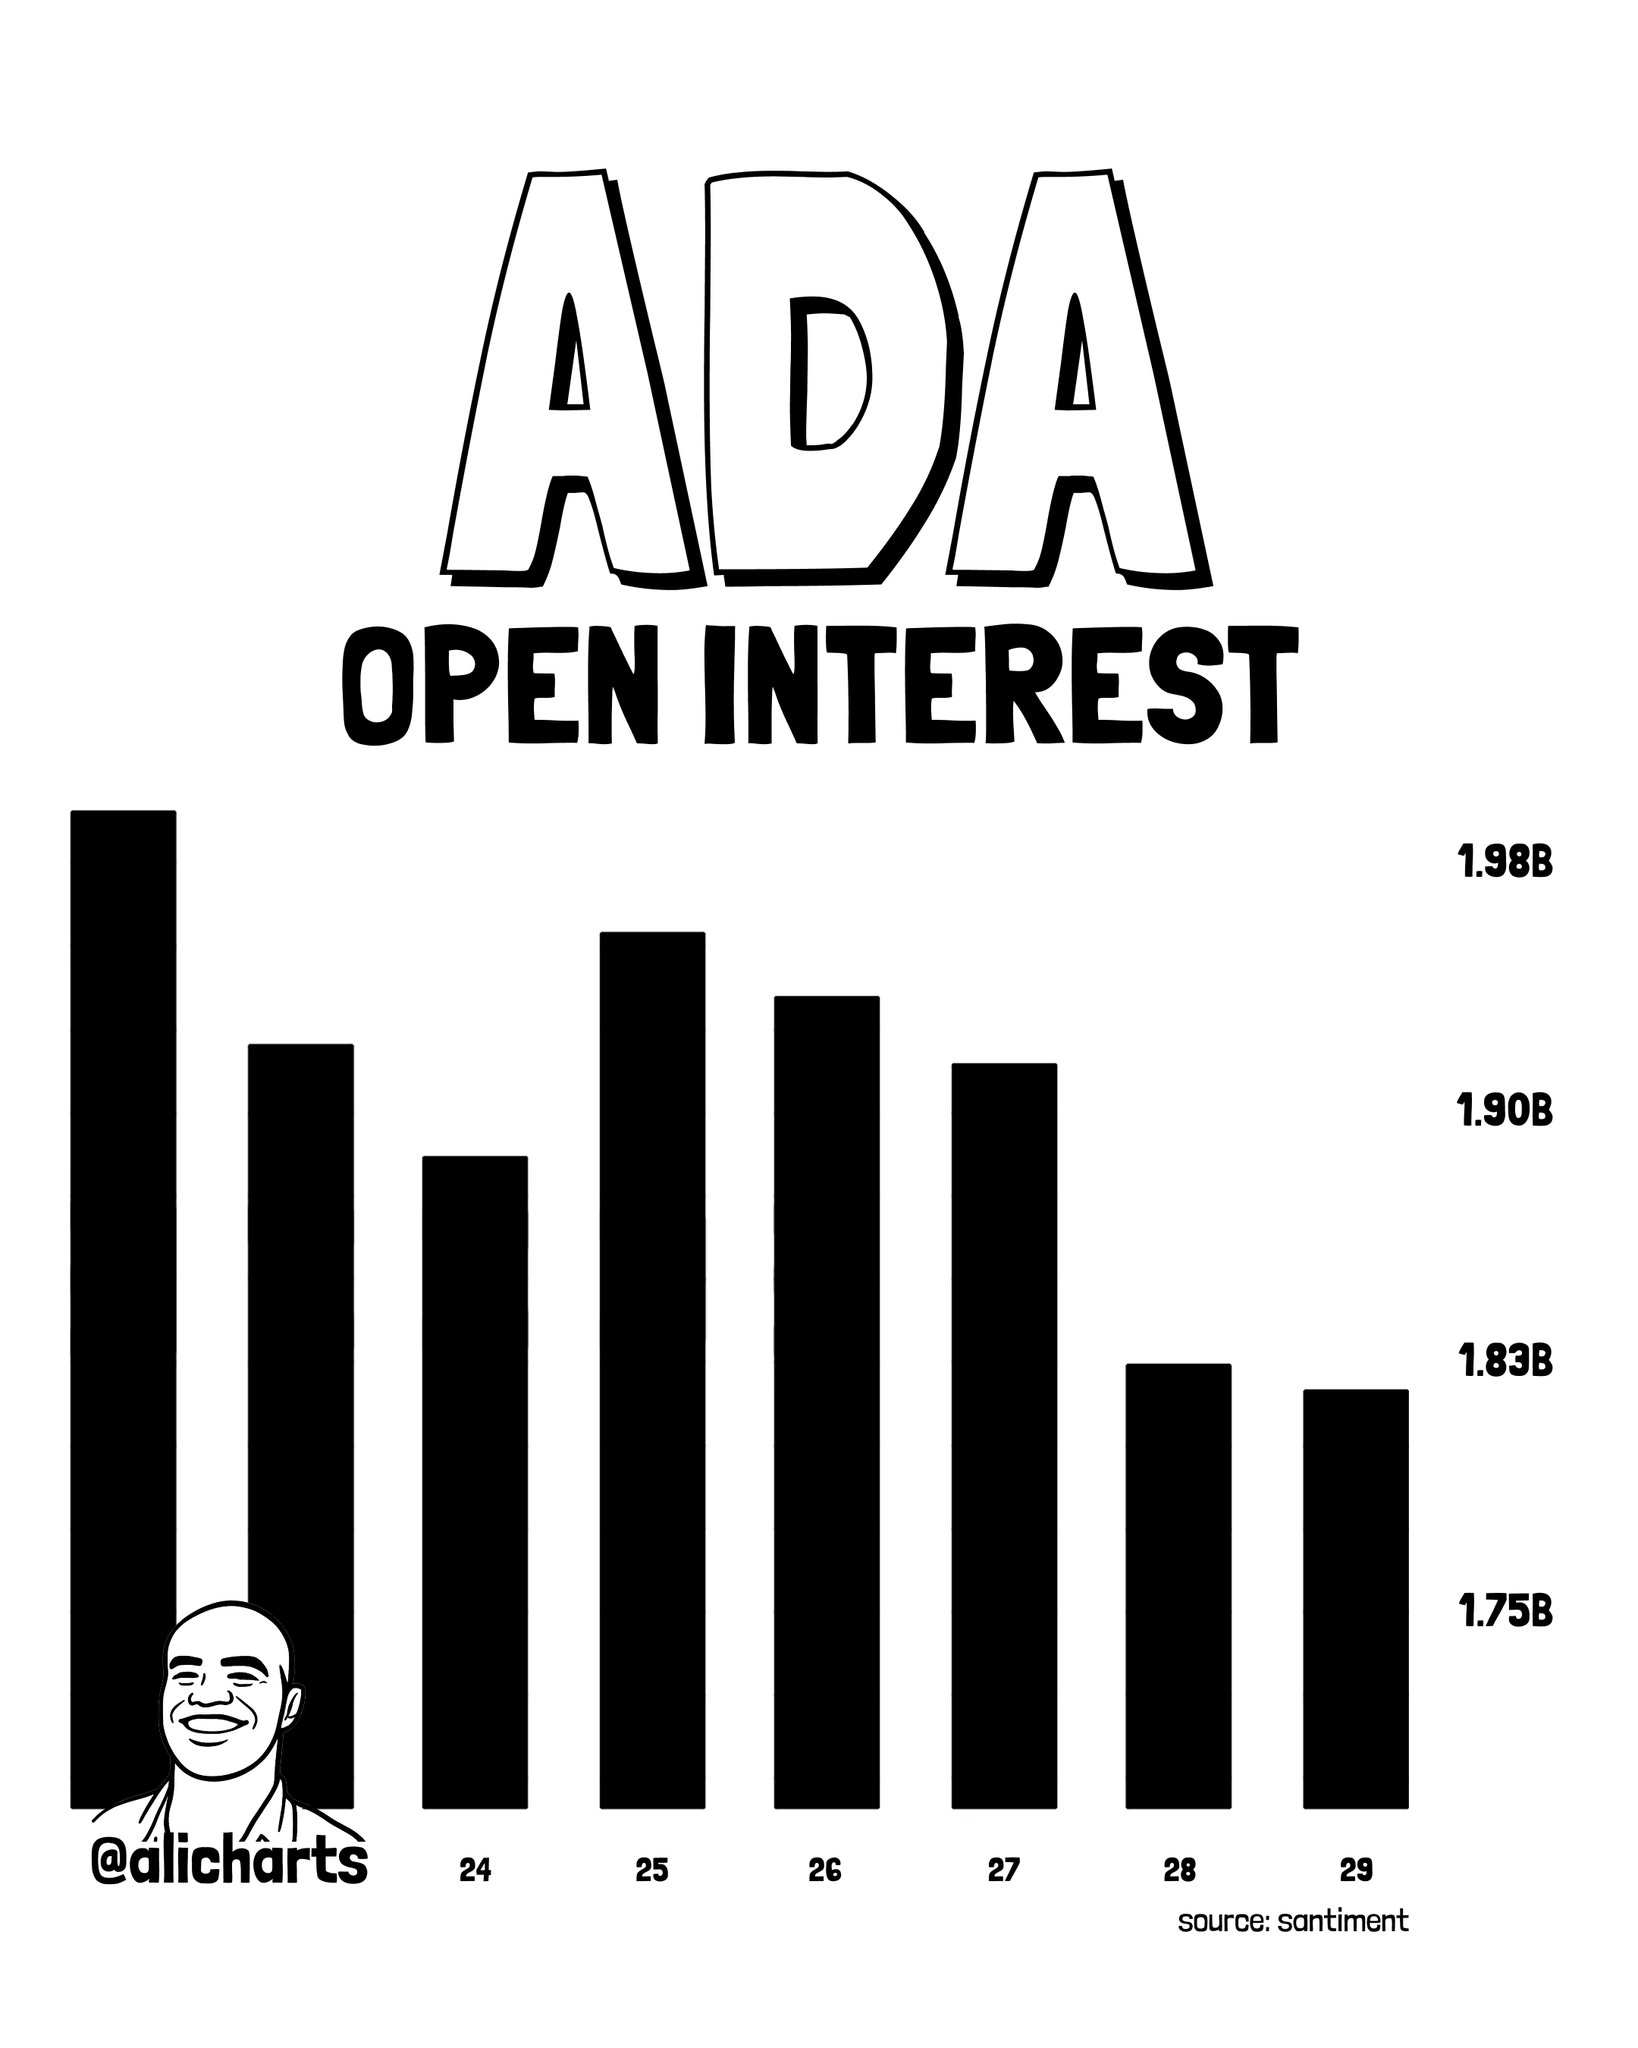
- ADA futures open interest falls 9% in 7 days — from $1.99B to $1.81B — per @alicharts
- Whales offloaded ~90M ADA worth $22.5M since September 20, adding sustained sell pressure
- Key OI support at $1.75B — a break lower extends the de-risking cycle; a hold signals reset
Cardano (ADA) is flashing a coordinated de-risking signal — futures open interest has contracted 9% in seven days while large holders have simultaneously reduced exposure by $22.5 million. Together, these two data points describe a market where conviction is draining from both the leveraged trading desk and the long-term accumulation side at the same time.
Signal 1 — ADA Futures Open Interest: $1.99B to $1.81B in Seven Days
Open interest measures the total number of outstanding futures contracts that have not been settled. When OI rises, new money is entering leveraged positions. When OI falls, existing positions are being closed — reducing the pool of speculative capital actively exposed to ADA price movements.
The 9% contraction — from $1.99 billion to $1.81 billion over seven days — is not a single-day flush. Ali Martinez’s chart shows a classic OI contraction pattern: a sharp drop from the $1.98–1.99B peak, a partial recovery on days 25–26 that failed to reclaim the high, and then renewed decline through days 28–29 with no recovery momentum visible on the final bars. The chart identifies a support zone near $1.75B — the floor where prior positioning has historically found a base.
 ADA Open Interest Analysis
Three implications follow from this reading. First, the pattern confirms consistent deleveraging — not a one-session event but a multi-day systematic unwinding of leveraged exposure. Second, the failed recovery attempt (days 25–26) shows that buyers who tried to re-enter at lower OI levels were absorbed and pushed out again — a bearish structural read. Third, if OI continues declining toward the $1.75B support level, it would signal that the majority of leveraged positions have been cleared — historically, that kind of full reset has preceded new positioning cycles.
What this signal does NOT say: falling OI alone does not confirm which direction price resolves. Deleveraging removes speculative excess — it can precede consolidation, further downside, or, once complete, a cleaner base for recovery. The direction depends on what happens to spot demand when leverage clears.
Signal 2 — Whale Distribution: 90 Million ADA ($22.5M) Offloaded Since September 20
The futures contraction is more significant because it coincides with whale distribution, not just passive leverage reduction. According to Ali Martinez’s thread, large holders have offloaded approximately 90 million ADA — worth roughly $22.5 million at current prices — since September 20. That is not a single large transaction. It is a sustained sell-down by addresses classified as whales across multiple days.
The mechanism matters here. When whales distribute into price strength, they absorb retail buying demand without allowing price to advance. The result is a price that appears supported on the surface while the underlying order flow is net negative. Combined with futures OI contraction — which removes the leveraged buyers who might otherwise absorb that whale selling — the two signals describe a market structure where both the speculative bid and the patient accumulation bid are simultaneously pulling back.
At $22.5 million across roughly ten days, the pace of whale outflows is approximately $2.25 million per day. That figure is not large enough to collapse price on its own — but it is sustained and directionally consistent with the OI data, which is the structural concern Ali Martinez flags.
Why Two Simultaneous Signals Carry More Weight Than One
Futures OI contraction alone can be noise — it sometimes reflects routine position management rather than directional conviction. Whale profit-taking alone can be a single entity rotating, not a systemic shift. When both occur simultaneously and in the same directional reading — reduced speculative demand, reduced large-holder conviction — the combined signal is more reliable than either data point in isolation.
The sequence Ali Martinez documents is a recognized pre-consolidation or pre-correction pattern: leveraged traders reduce exposure first (OI falls), then large holders realize profits into remaining spot liquidity (whale outflows), then retail is left holding a thinner order book with less institutional and speculative support underneath it. Whether that sequence leads to a sharp correction or simply a period of sideways price action depends on what happens to the $1.75B OI support level and whether spot buying absorbs the remaining whale distribution.
The Levels That Define What Comes Next
Two specific thresholds now define the near-term read on ADA futures positioning:
- $1.75B OI support — If open interest continues declining to this level, it signals a near-complete deleveraging cycle. Historically, full OI resets at established support zones have preceded new directional moves. A stabilization here followed by OI recovery would be the first sign that the de-risking phase is ending.
- $1.99B OI resistance — A recovery back above the prior peak open interest would signal new leveraged capital entering ADA futures — the inverse of the current signal. That level is 10% above current OI and would require a structural shift in trader conviction, not just a price bounce.
Bullish Scenario — OI Stabilizes at $1.75B
If open interest finds a floor at the $1.75B chart support and begins recovering — while whale distribution slows — the de-risking cycle would be classified as complete. New positioning at lower leverage levels would provide a cleaner technical base for ADA price recovery. The bullish read requires OI to stop declining AND whale outflows to reverse to net accumulation.
Bearish Scenario — OI Breaks Below $1.75B
If open interest breaches the $1.75B support zone with no stabilization, it signals that deleveraging has not yet run its course. Continued whale distribution into a thinner futures market would remove two layers of support simultaneously — increasing the probability of a deeper price correction. This scenario invalidates the reset thesis and opens the possibility of a more extended consolidation phase.
The broader bull market context remains relevant — as Tom Lee has declared crypto has entered a bull market — but short-term ADA-specific data is currently running counter to that macro tailwind.
Ali Martinez’s full thread contains additional data points through slide 4/6 and beyond. The two signals documented here — $180 million in OI reduction and $22.5 million in whale outflows — are the primary quantitative anchors. Watch the $1.75B OI floor as the single most important near-term level: a hold confirms the reset thesis; a break extends the de-risking cycle.
Frequently Asked Questions
What does a 9% open interest drop mean for ADA price?
How significant is 90 million ADA in whale outflows?
What is the key open interest level to watch for a recovery signal?
Does falling open interest always mean ADA price will decline?

CoinsProbe may publish sponsored articles, affiliate links, or promotional collaborations. All sponsored material is clearly labeled to maintain transparency with our audience. Our editorial decisions remain fully independent, and advertising partnerships do not influence reviews, rankings, or published opinions.
Since 2023, CoinsProbe has delivered reliable insights on cryptocurrency, blockchain, and digital assets. Our content is created by experienced researchers and analysts who follow strict editorial standards focused on accuracy, transparency, and credibility. Every article is carefully reviewed and verified using trusted sources and current market data. We provide unbiased analysis and timely updates covering everything from emerging crypto projects to major industry developments.


