

 invezz.com
A confirmed breakout above $80 would place the cryptocurrency on course for an initial advance toward $95-$100 and potentially a broader rally to $135.
$LTC traded near $71 on September 25, representing an increase of more than 30% from its recent low around $50.
The recovery has strengthened momentum on the two-week chart, but buyers must overcome several closely aligned technical barriers before the longer-term bullish scenario can be confirmed.
Litecoin briefly taps the $80 resistance
Litecoin’s recovery has carried its price back above the 20-period exponential moving average on the two-week chart, currently located near $59.
Reclaiming this moving average is a constructive development because it suggests that the medium-term trend is improving after a prolonged period of weakness.
However, Litecoin briefly touched the $80 resistance before sellers rejected it, sending the price down to $71 at press time.
This zone contains several major moving averages, including the 50-period EMA near $71.56, the 200-period EMA around $77.10, and the 100-period EMA at approximately $79.31.
The concentration of these moving averages makes the area especially important.
Traders who bought during previous periods may use a return to these levels to exit positions, while bearish participants could initiate new shorts in anticipation of another rejection.
As a result, a temporary move above $80 would not necessarily be enough to validate the bullish outlook.
Litecoin would need to record a decisive two-week close above that level, demonstrating that buyers can overcome both the moving-average cluster and the multi-year descending resistance line.
Confirmed breakout could put $135 in play
If Litecoin confirms the breakout, its first significant upside target would sit between $95 and $100. This area represents an important psychological and technical hurdle that could attract profit-taking.
A clean move above $100 would strengthen the case for a continuation toward the broader $125-$135 resistance zone. From the current price near $71, an advance to $135 would represent a gain of approximately 90%.
The $135 target is not based solely on the expected size of the breakout. It is also a major horizontal resistance level visible across Litecoin’s long-term chart.
$LTC has previously experienced increased volatility and selling pressure around this region, making it a logical destination if the bullish structure develops as expected.
Nevertheless, the projected move is conditional. Litecoin remains below $80, and the collection of technical barriers in that area means the breakout has not yet been confirmed.
The daily Relative Strength Index also favors the bullish interpretation. The RSI has climbed to 79, currently in the overbought region.
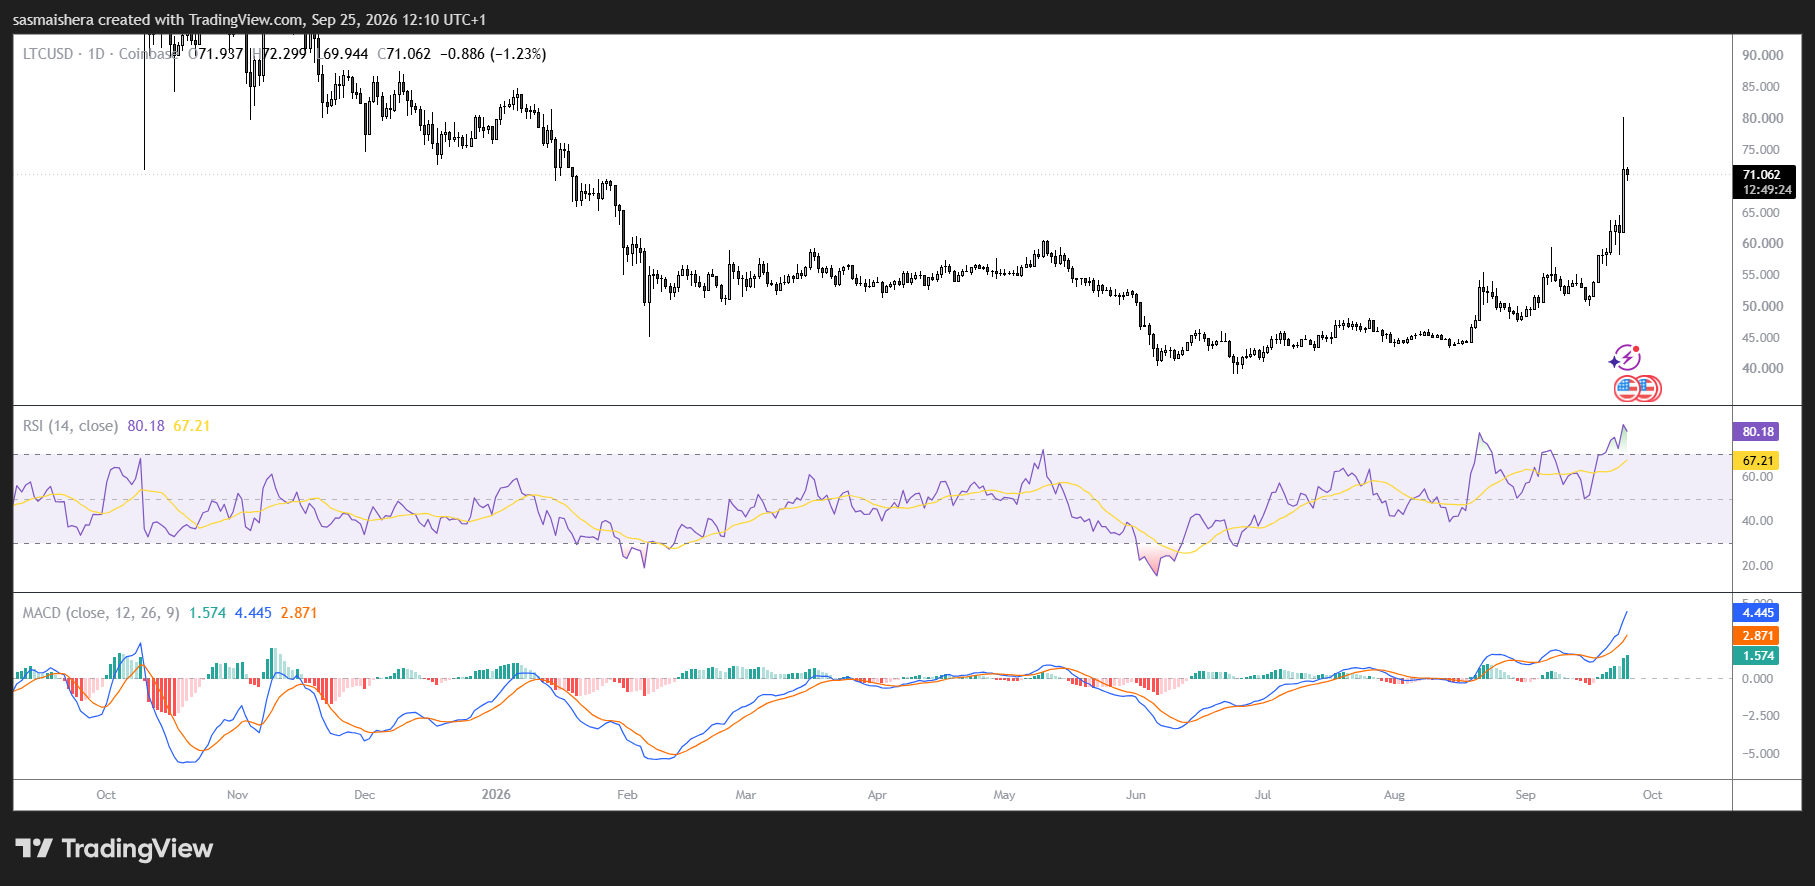
An RSI above 70 generally indicates that buying momentum is strong and could encounter a rejection in the near term.
If the rejection of the $80 resistance stands, its first meaningful downside target would be the 20-period EMA near $59. That level previously acted as resistance and could now provide support during a pullback.
A successful defense of $59 would preserve the improving long-term structure and allow Litecoin to consolidate before attempting another breakout.
A sustained decline below that level, however, would place the recent $50 low back in focus.


