
Micron Q4 Earnings Preview: Super-Cycle Meets High Expectations and Short Pressure
 2026/09/24 06:41
🔥 US Stock Hotspot Radar is Live! Content: 3 major themes + 6 selected stocks + 7 key events. Where are this week’s opportunities? Click the link to see all 22 trading directions in one chart →
- Investment Snapshot
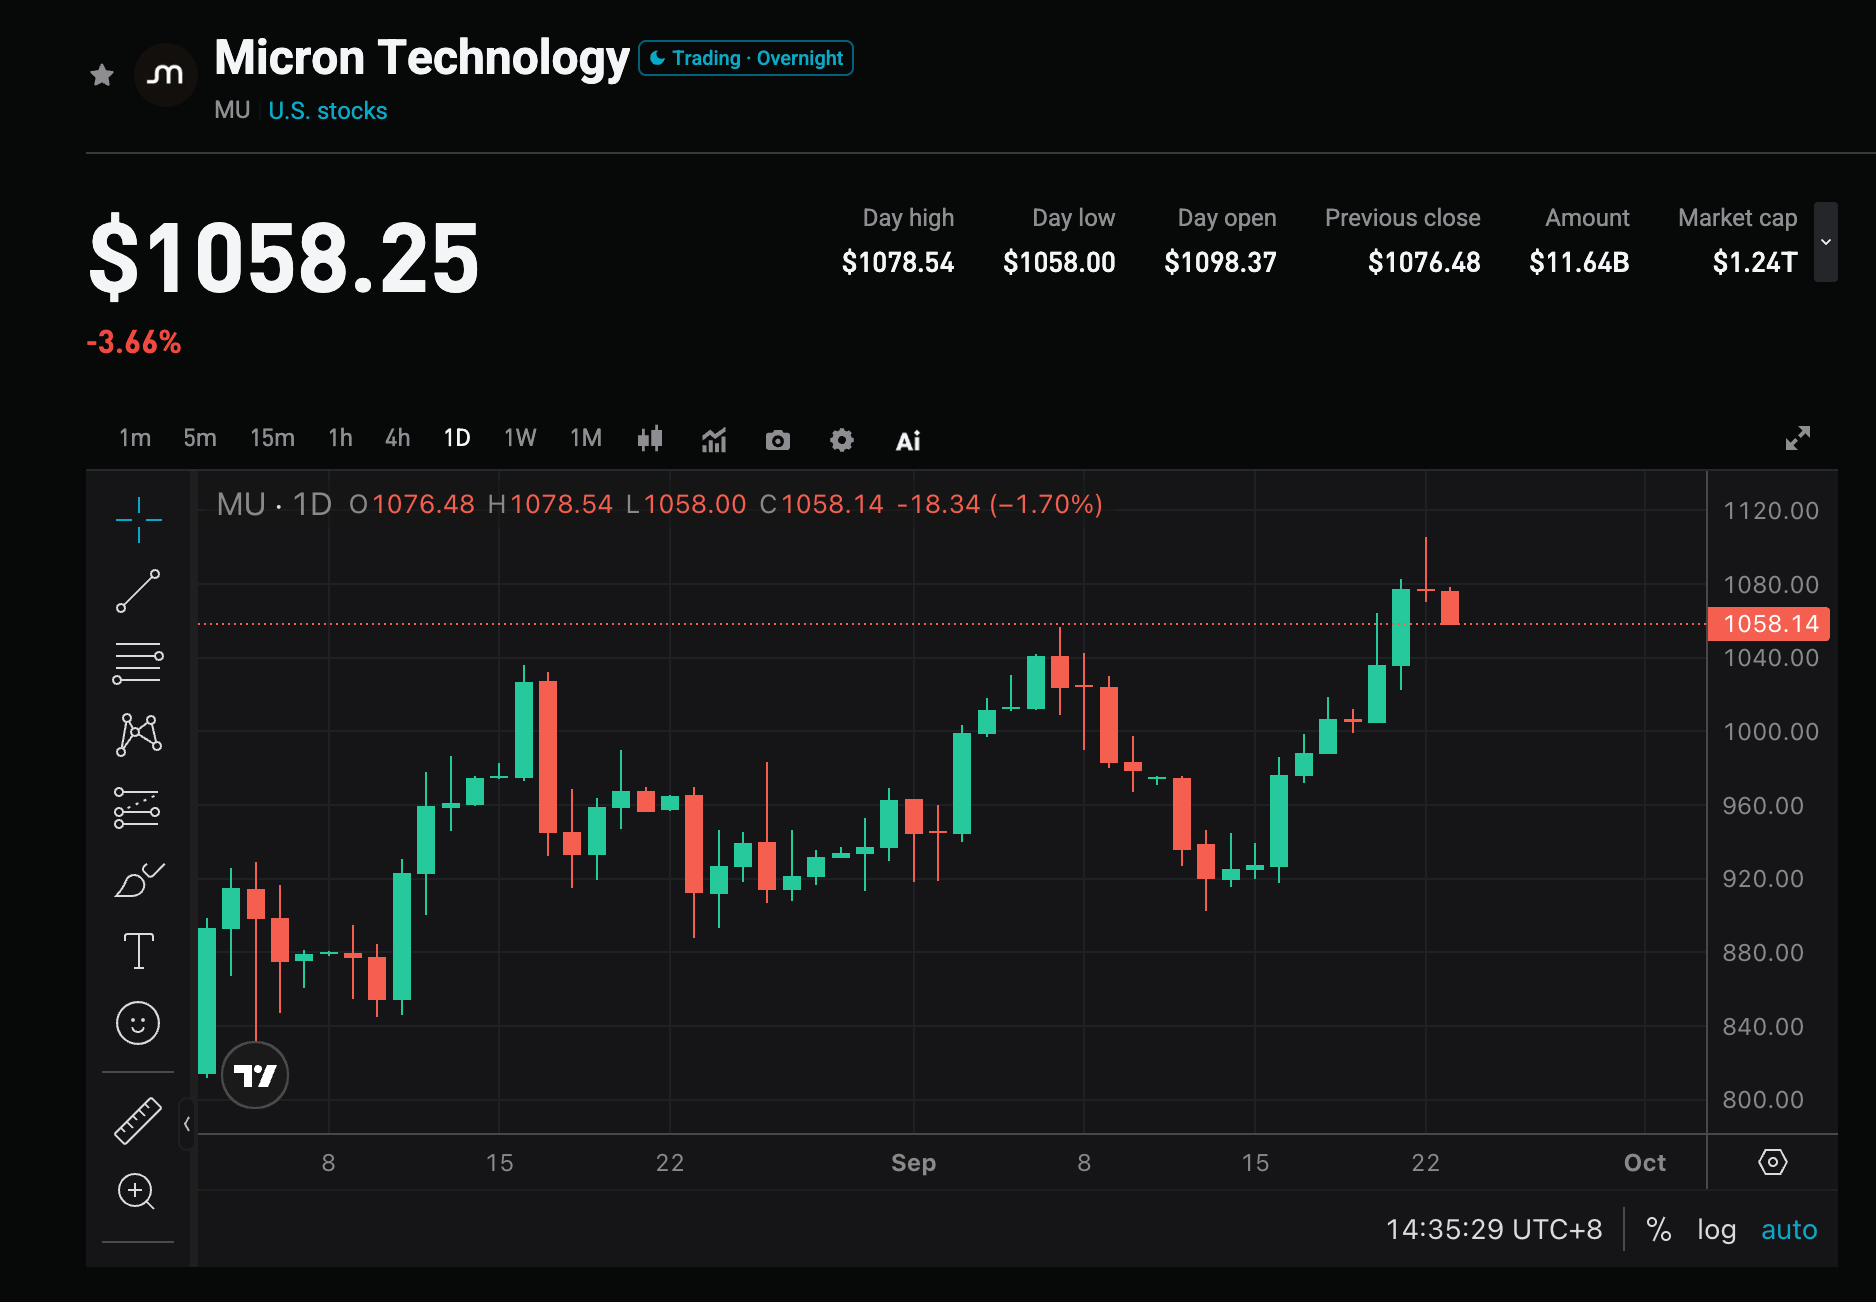
Micron Technology (MU.US) will report fiscal Q4 2026 results after the U.S. close on September 30, 2026, with the conference call at 4:30 p.m. ET. Company guidance is revenue of $50 billion ± $1 billion, non-GAAP gross margin of about 86%, and adjusted EPS of about $31 ± $1. Wall Street consensus is revenue of about $50.8–$51.1 billion (about +349% YoY) and adjusted EPS of about $31.43 (versus $3.03 a year ago). As of the September 23 close at $1,071.88, the stock was down 2.22% on the day. Year-to-date the share price is up about 276%, still about 14.6% below the June 25 high of $1,255. Ahead of the print, a high-profile short add sits against a Wall Street Buy consensus. The real debate is whether next-quarter guidance can be raised again, and how much runway is left in the memory upcycle.
- Four Focus Points
Focus 1: Can the $50 billion run-rate land, and is next-quarter guidance the real pricing event
Q3 revenue already reached $41.46 billion (+345.7% YoY), with adjusted EPS of $25.11, well above the prior consensus. The Q4 guide midpoint is already a record, and the Street is slightly above the company range. Some houses see Q4 revenue at $50.8–$52.0 billion and want FY2027 Q1 EPS guidance in the $35–$37 range. A print that only hits the midpoint, with a cautious outlook, would be more likely to trigger profit-taking after such a large move.
Focus 2: How long sold-out HBM and DRAM pricing can still carry the story
AI training and inference demand for HBM and high-capacity DRAM remains the core driver. Management has said 2026 HBM capacity is sold out, and some commentary points to visibility into 2027. Multi-year supply agreements also lift earnings visibility. At the same time, Micron already flagged in Q3 that the Q4 margin outlook embeds a slower rate of price increases. Whether calendar-Q3 DRAM contract prices can still rise at a double-digit sequential pace, and how fast HBM4 ramps, will decide how much beat is left.
Focus 3: Is gross margin near the end of this expansion cycle
Q3 non-GAAP gross margin was about 84.9%, with Q4 guided to about 86%. Some on the Street argue margin expansion is more than 80% complete, so further upside may come more from mix, price stickiness, and multiple re-rating than from another step-up in margin. If the actual margin stalls near 86% and management stresses slower pricing, the tape may shift from “margins still expanding” to a “cycle-peak” trade.
Focus 4: How much the short narrative can distort the tape
On September 23, MU fell 2.22% to $1,071.88 after a well-known short seller added to bearish bets on Micron, a semiconductor ETF, and other AI names. The thesis is that conventional DRAM supply is catching up and a downcycle may follow, citing downstream comments that DDR4 now has more sellers than buyers. Official short interest is not extreme: about 2.6% of the float, or about 29.71 million shares. The risk is not the short count itself. It is that if the report fails to push back on a cycle-turn narrative, positioning can amplify the move. As of September 23, options implied about a ±10.3% move around the September 30 after-hours report.
- Risks and Opportunities
Upside catalysts:
- Q4 revenue, EPS, and gross margin all clear the guide midpoint, with FY2027 Q1 outlook above consensus.
- HBM stays sold out, long-term contract coverage rises, and management reiterates tightness into 2027–2028.
- Free-cash-flow and capital-return comments beat expectations, supporting the view that peak profits can be converted into cash, not just cycle accounting.
Downside risks:
- Results only meet guidance and the next-quarter outlook is flat, triggering a “buy the rumor, sell the news” reaction.
- Conventional DRAM/NAND pricing signals weaken, raising concern that products outside HBM are already softening.
- China capacity adds, easing supply bottlenecks, or downstream order-cut rumors, on top of a very large year-to-date move that still needs to be digested.
- Trading Framework
Bull case: If Q4 clearly beats the $50 billion / $31 midpoint and next-quarter guidance is raised, with constructive HBM and contract-price comments, the short narrative can fade and the stock can reprice FY2027 earnings.
Bear case: If the print is only “in-line,” margin expansion is framed as slowing, or management sounds more cautious on 2027 supply-demand, high expectations plus short-side headlines can produce a pullback close to or beyond the options-implied range.
Key numbers:
- Total revenue and YoY / QoQ growth
- Non-GAAP gross margin and adjusted EPS
- HBM shipments, long-term contract coverage, and FY2027 Q1 guidance
- Free cash flow, capex, and capital-return language
Tactical notes (MU, as of the September 23 close at $1,071.88):
- Pre-earnings: The stock bounced from the mid-September $902–$925 shelf, closed September 22 at $1,096.16, then tagged $1,105.50 on September 23 before finishing at $1,071.88. The 20-day average is about $979.69, the 50-day about $933.51, and the 200-day about $652.70. Nearby resistance is $1,096–$1,106, then $1,132 / $1,154 / $1,213–$1,255. Nearby support is $1,064 / $1,044–$1,048, then $1,016 / $975–$980. Event risk/reward is only average. Options imply about ±10.3% (roughly $961–$1,182). Keep event size light. Avoid leveraged longs below $1,030.
- Long structure: Close back above $1,096–$1,106 and hold a retest of $1,044–$1,048. Upside references are $1,132 / $1,154, then $1,213 / the $1,255 prior high. Stops can sit at $1,030, or lower toward the 20-day near $979 depending on risk tolerance.
- Short / hedge structure: A gap that cannot reclaim $1,044–$1,048, or a failed push through $1,096–$1,106. Downside references are $1,016 / $975–$980 / $933 (50-day) / $900.
How to use it: Expectations are already high. Trade the slope of guidance, not the year-over-year explosion that is already in the model. If the beat and outlook are strong, look for post-print structure back toward $1,044–$1,096. If the print is dull or the cycle tone turns cautious, do not chase. Watch IV crush if holding long options. Size and stops should match personal risk tolerance.
Disclaimer: This is for information only and is not investment advice.
Disclaimer: The content of this article solely reflects the author's opinion and does not represent the platform in any capacity. This article is not intended to serve as a reference for making investment decisions.
You may also like
SoFi tie-up shows stablecoins can provide alternative blockchain settlement rail
Slowing AI models may not necessarily be bearish: three structural tailwinds for traditional data centers outweigh rising interest rates
HSBC believes that the traditional growth logic of data centers is shifting from frontier model iteration to AI commercialization and diffusion. With the rise in inference demand and increased capital expenditure from cloud service providers, combined with tightening power and regulatory constraints, the supply-demand imbalance is expected to persist until 2028. Even with rising interest rates, the compound annual growth rate of AFFO per share is still expected to reach 11%–12% from 2025 to 2028, demonstrating strong earning resilience.
This time, will U.S. Treasury bonds crash U.S. stocks?
Bloomberg strategist Simon White warns that the recent rise in US Treasury yields is shifting from a "benign" increase driven by interest rate expectations to a disorderly surge fueled by expanding term premium. Market analysts note that higher long-term interest rates will simultaneously push up US stock valuation discount rates and corporate financing costs, intensifying liquidation pressure on highly leveraged assets. If interest rates above 5% become the new norm, US stock valuations will face ongoing compression pressure.
Crypto prices
More


