

 thecryptobasic.com
Historical market data suggests $XRP may still have room to decline further before eventually finding its bottom for this cycle.
$XRP made an impressive recovery last week, climbing to $1.69 before sellers stepped in and pushed the price back down. The cryptocurrency has since fallen toward $1.42, as investors question whether the recent recovery has already run its course.
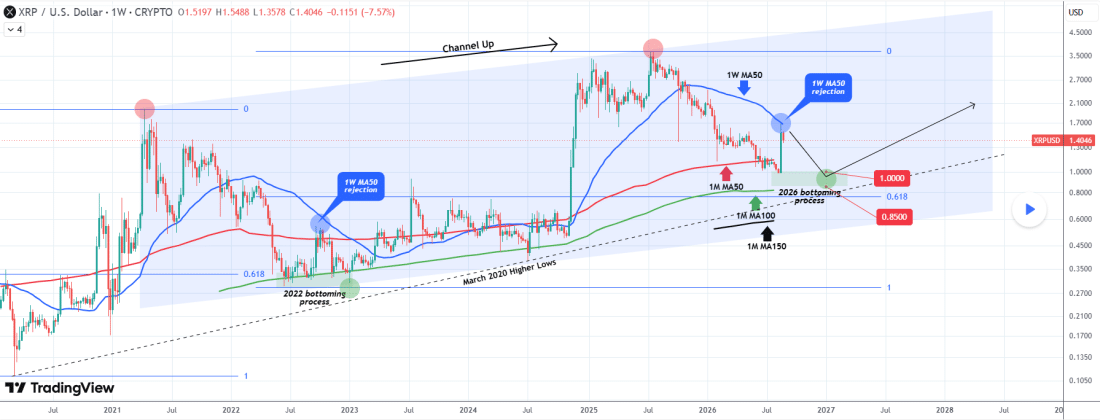
However, the weekly chart suggests that $XRP may not have reached its cycle bottom yet. The current price action looks similar to what happened during the previous bear cycle, particularly after $XRP faced rejection at the 1-week 50-period moving average (MA50).
Based on this pattern and several important support levels, $XRP could still have another move lower before finding a lasting bottom.
$XRP Remains Inside a Long-Term Channel
$XRP has traded inside a broad Channel Up pattern since the April 2021 Cycle Top. This channel has contained the cryptocurrency’s major price movements through the 2022 bear market, the following accumulation period, and the rally that eventually led to a new Higher High at $3.66 in July 2025.
The July 2025 peak marked the confirmed top of the latest Bull Cycle. $XRP has since moved into a new bear-cycle phase as the market searches for its next major bottom.
Although $XRP recently recovered to $1.69, its decline back toward $1.42 suggests that buyers have not yet gained enough strength to change the broader trend.
1W MA50 Rejection Could Lead to Another Decline
$XRP’s recent rejection at the 1-week 50-period moving average has become one of the most important developments on the chart. $XRP reached the MA50 last week for the first time in nine months. Before that, the cryptocurrency last tested the level on Nov. 10, 2025.
The reaction also looks similar to $XRP’s position in 2022. Specifically, on Sept. 19, 2022, $XRP rallied into the 1W MA50 before sellers pushed the price back down.
 $XRP Historical Bottom Structure
The cryptocurrency then made another move lower before getting close to its previous cycle low. With the current structure showing a similar pattern, $XRP could see another decline before it finds stronger support.
Notably, in September 2022, $XRP did not immediately find a bottom after losing momentum at the 1W MA50. Instead, it made another significant move lower before finding stronger support around the 1-month 100-period moving average (MA100).
This same moving average later became important during $XRP’s 2023 to 2024 Accumulation Phase. It provided support for an extended period and helped establish a floor beneath the market. If $XRP follows a similar path this time, the 1M MA100 could again become an important level for buyers.
Key Level that Could Mark the $XRP Bottom
Several technical levels now point toward the $1 to $0.8 range as a possible area for $XRP to find its cycle bottom. The range includes the 1M MA100, the 0.618 Fibonacci retracement from the previous cycle, and the March 2020 Higher Lows trend-line.
The combination of these levels makes the zone more important than any single support level on its own. The 0.618 Fibonacci retracement deserves particular attention because $XRP spent much of the 2022 bottoming process testing this level. The same area could attract buyers again during the current cycle.
Even if $XRP falls toward the $1 to $0.85 range, the cryptocurrency still has another major long-term support level below it. The 1-month 150-period moving average (MA150) remains an important part of $XRP’s broader market structure.
A monthly close above the MA150 would keep the long-term Channel Up structure intact. This means a decline toward $1 to $0.85 would not necessarily indicate a breakdown in $XRP’s long-term trend. Instead, it could represent another stage of the current bear-cycle bottoming process.


