Kite [KITE] emerged as an unexpected beneficiary of the crypto rally over the last 24 hours, with its market capitalization climbing by roughly $48.6 million. This, as its value surged by around 23% on the charts.
Now, market bulls may be commanding the headlines. And yet, on a structural level, KITE seemed to be weakening at press time. In fact, a pullback appeared likely as buyers grew briefly exhausted on a short-term basis.
KITE stalls inside a key supply zone
On a structural basis, KITE may be in a vulnerable position right now.
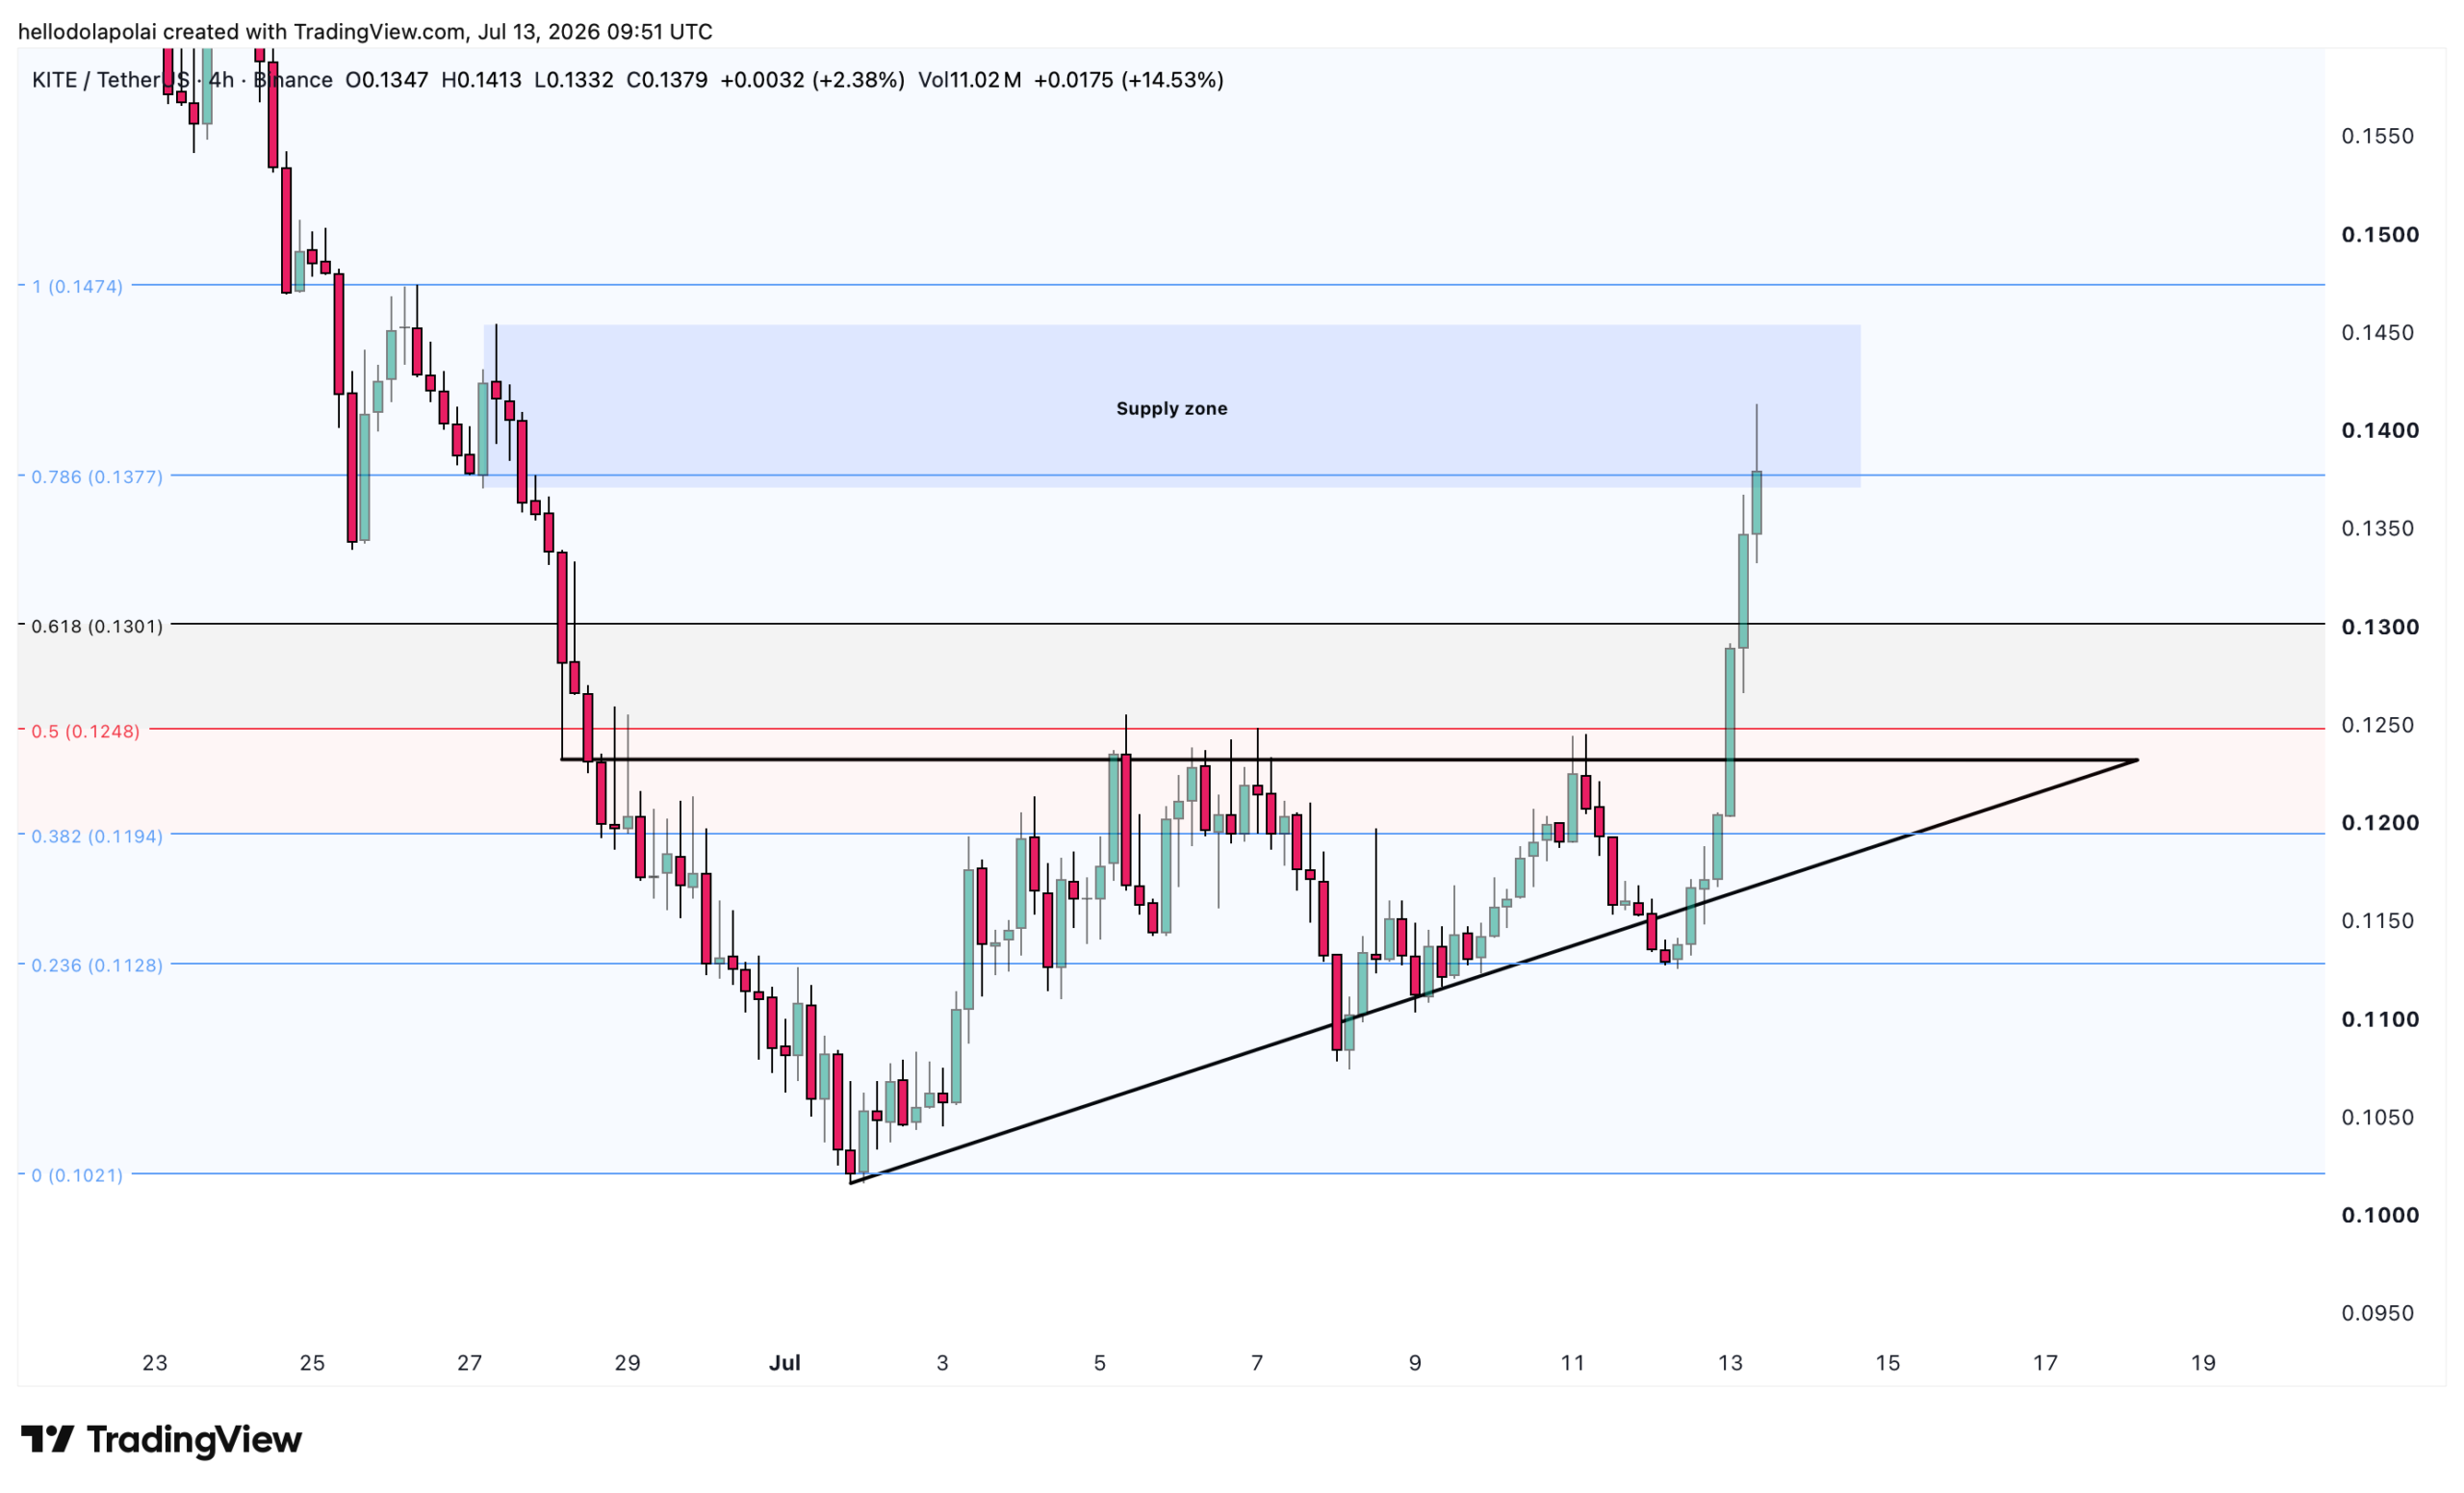
The altcoin’s latest rally pushed the crypto into a key supply zone on the 4-hour chart. Supply zones mark the areas where sell orders accumulate, and the probability of a decline from that level always runs high.
 Source: TradingView
That level also seemed to coincide with the 0.786 Fibonacci resistance, signaling firm resistance as the price traded into this territory.
Given the selling pressure at this zone, a potential pullback would drag KITE towards support levels on the chart.
Analysis also pointed to the nearest support zone at the 0.618 Fibonacci level (or $0.13). Should that fail to attract enough buy orders to lift the price, KITE would slide to the 0.5 Fibonacci line (or $0.124).
If the price retraces into the bullish structure that preceded its rally—marked by the black line—that structure will be invalidated. This would mean that bears in effect will set the tone for the price going forward.
Momentum indicators show buyer pressure fading
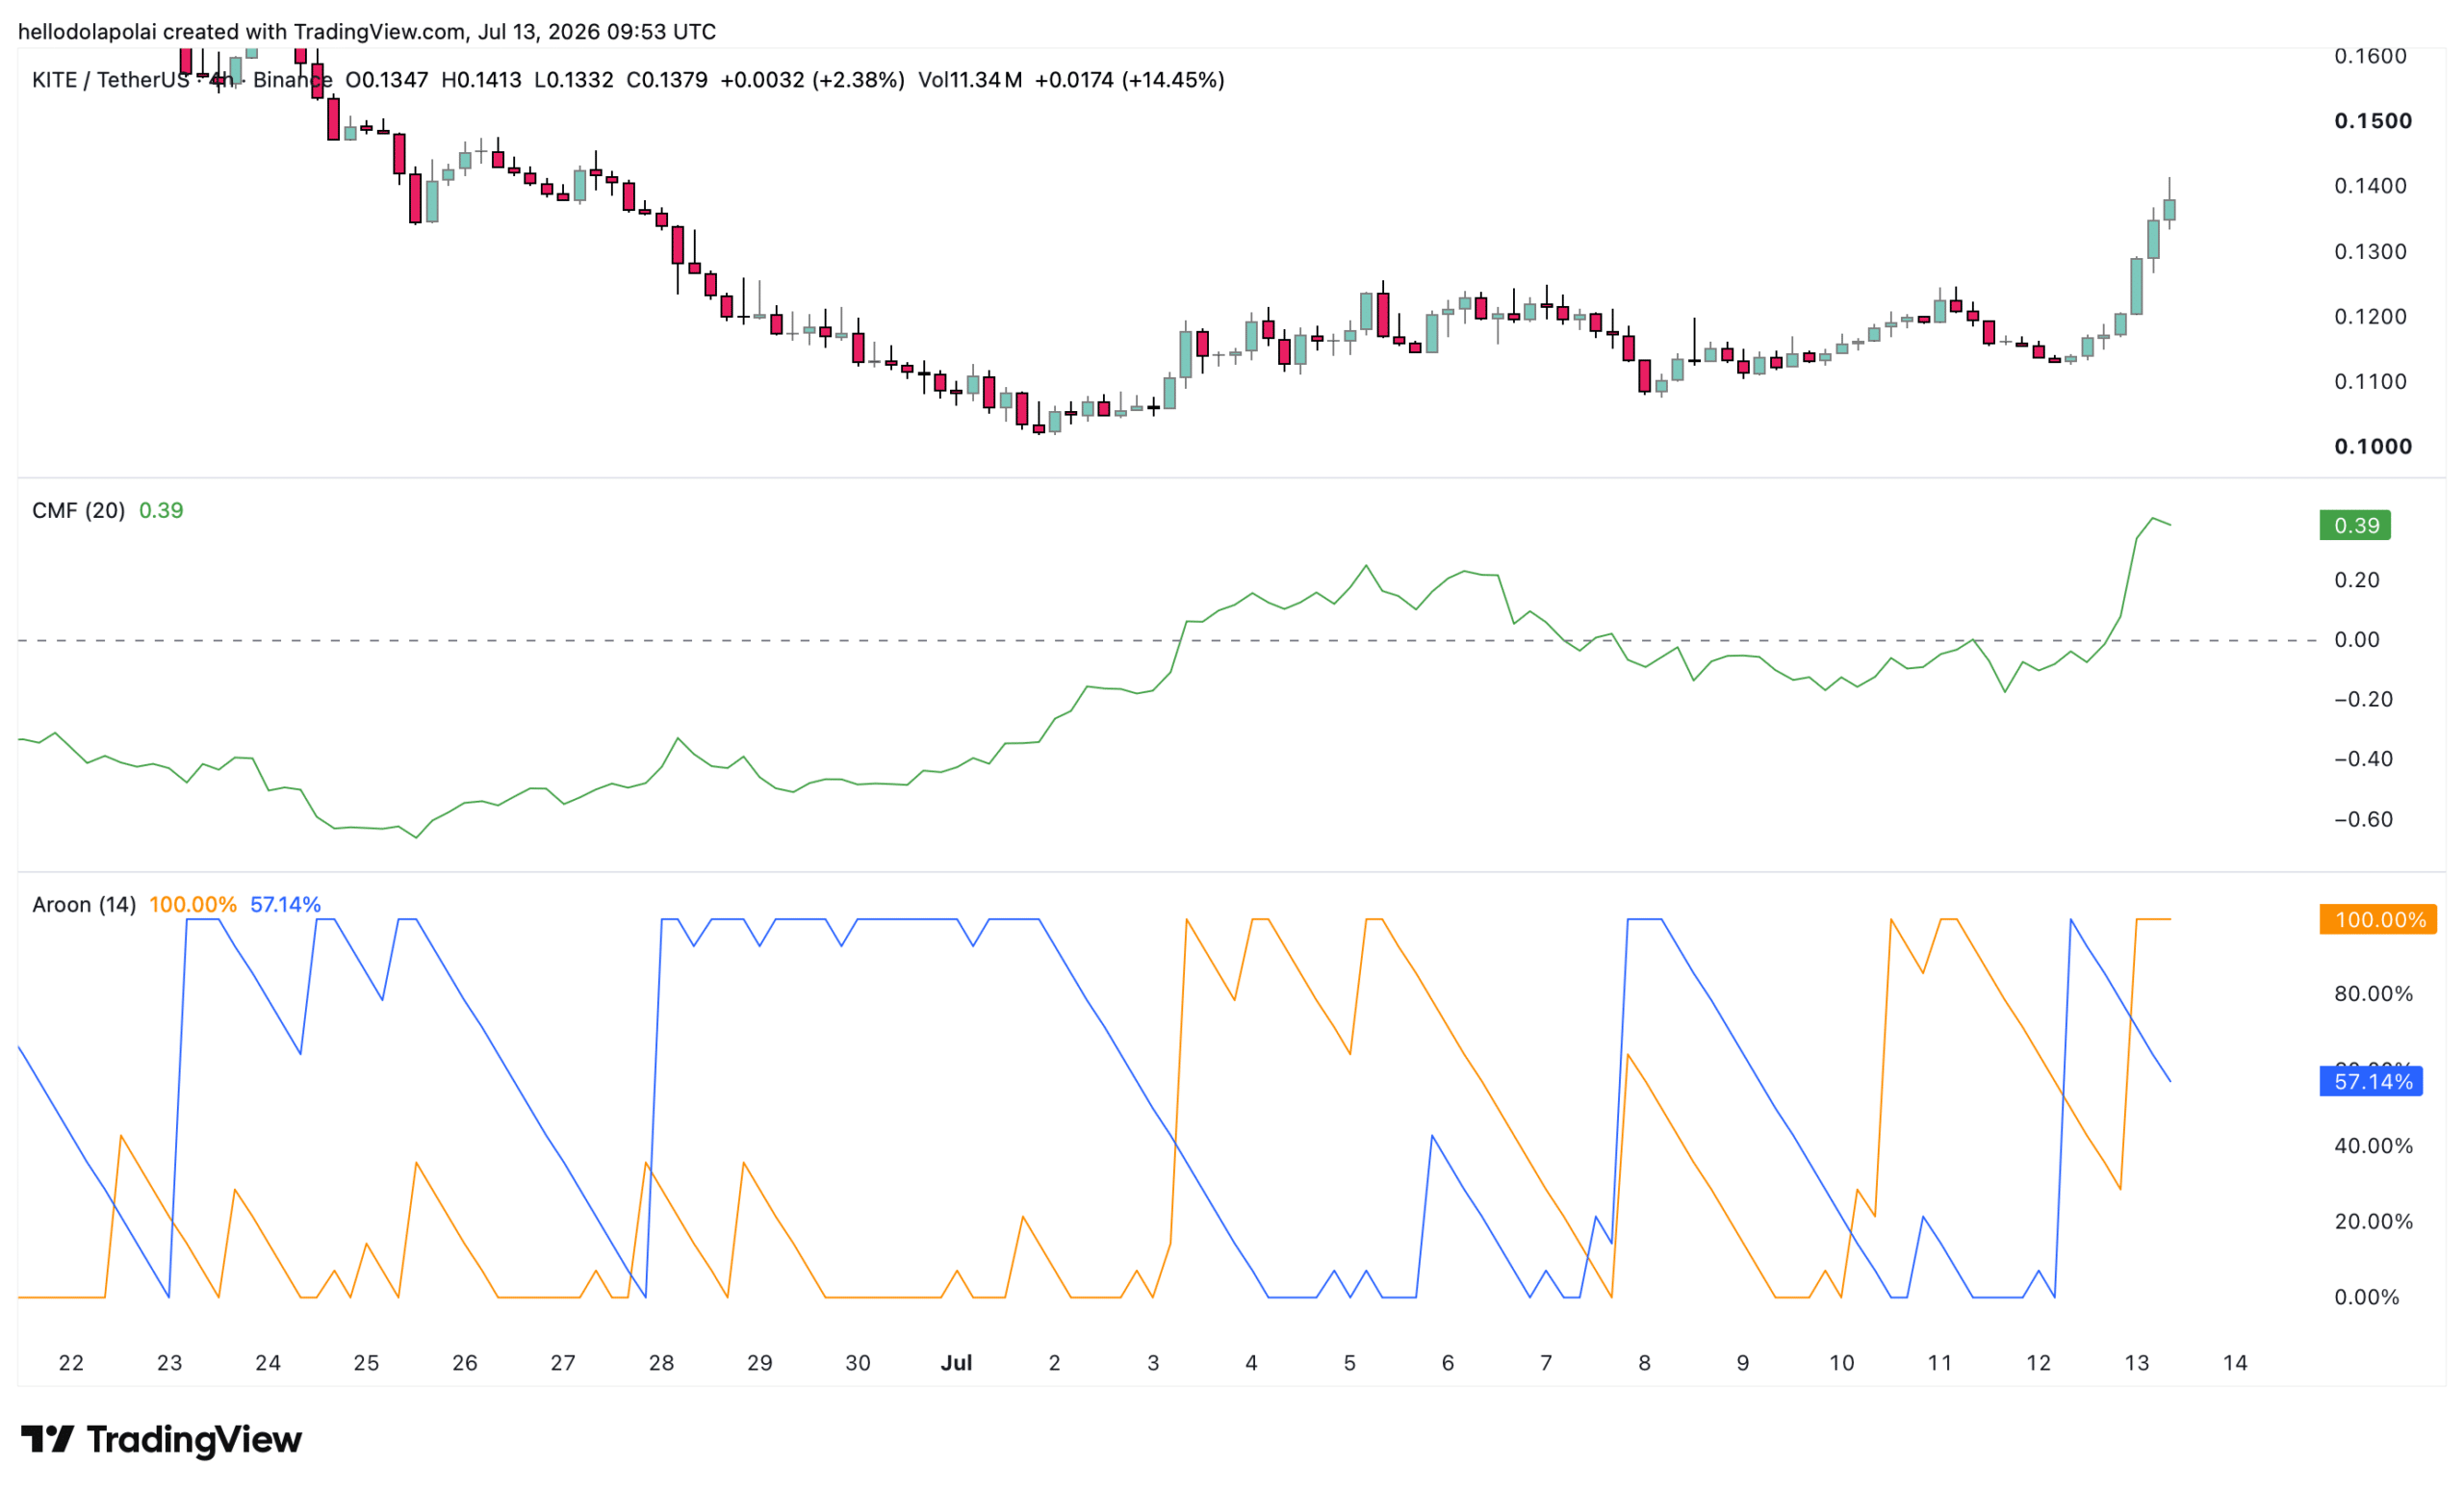
Buyer pressure no longer held the strength it carried earlier either. The Chaikin Money Flow (CMF) stood out as one key indicator reflecting that decline. The overall CMF trend had a reading of 0.39, but a slight downtick alluded to a hike in selling volume too.
 Source: TradingView
While the reading did not really confirm a bearish trend, a sustained decline would send the price backwards in the short term. Unless the CMF flips into negative territory on the chart.
The press time placement of the Aroon Indicator added to this outlook. Especially as the Aroon Up sat at its maximum reading of 100% while the Aroon Down held at roughly 57%.
Until that gap widens to 100% on the Aroon Up and 0% on the Aroon Down, the market won’t be committed to a decisive bullish phase. A strengthening bull trend typically sustains those readings.
Spot data shows investors cashing out of KITE
Finally, spot market data seemed to confirm that investors may indeed be cashing out on KITE.
Spot Netflow data from CoinGlass hinted at a net sell, with Netflow reaching roughly $312,000, while total KITE sales over the period amounted to around $5.72 million.
When selling pressure climbs this high, the price tends to scale back, in line with the previous trend that tied these sales to KITE trading into the supply level on the chart.
Final Summary
- KITE’s 23% surge drove it straight into the 0.786 Fibonacci resistance, a supply zone where stacked sell orders leave the asset exposed to a slide.
- Spot Netflow turned negative at roughly $312,000 against $5.72 million in total sales.