
A chart of commodity support and resistance: Gold, Silver, Oil, Gas + Platinum, Palladium, Copper, Agricultural Futures (July 1, 2026)

Huitong Finance July 1st – A single chart shows commodity support and resistance: gold, silver, oil, gas + platinum, palladium, copper + agricultural futures, updated at 06:30 (UTC+8) on Wednesday, July 1, 2026. Specifically covering 14 varieties including gold, silver, platinum, palladium, copper + crude oil, natural gas, fuel oil + wheat, corn, and cotton. For more details, please refer to the special chart produced by Huitong Finance Analysis.
A single chart shows commodity support and resistance: gold, silver, oil, gas + platinum, palladium, copper + agricultural futures, updated at 06:30 (UTC+8) on Wednesday, July 1, 2026. Specifically covering 14 varieties including gold, silver, platinum, palladium, copper + crude oil, natural gas, fuel oil + wheat, corn, and cotton. For more details, please refer to the special chart produced by Huitong Finance Analysis.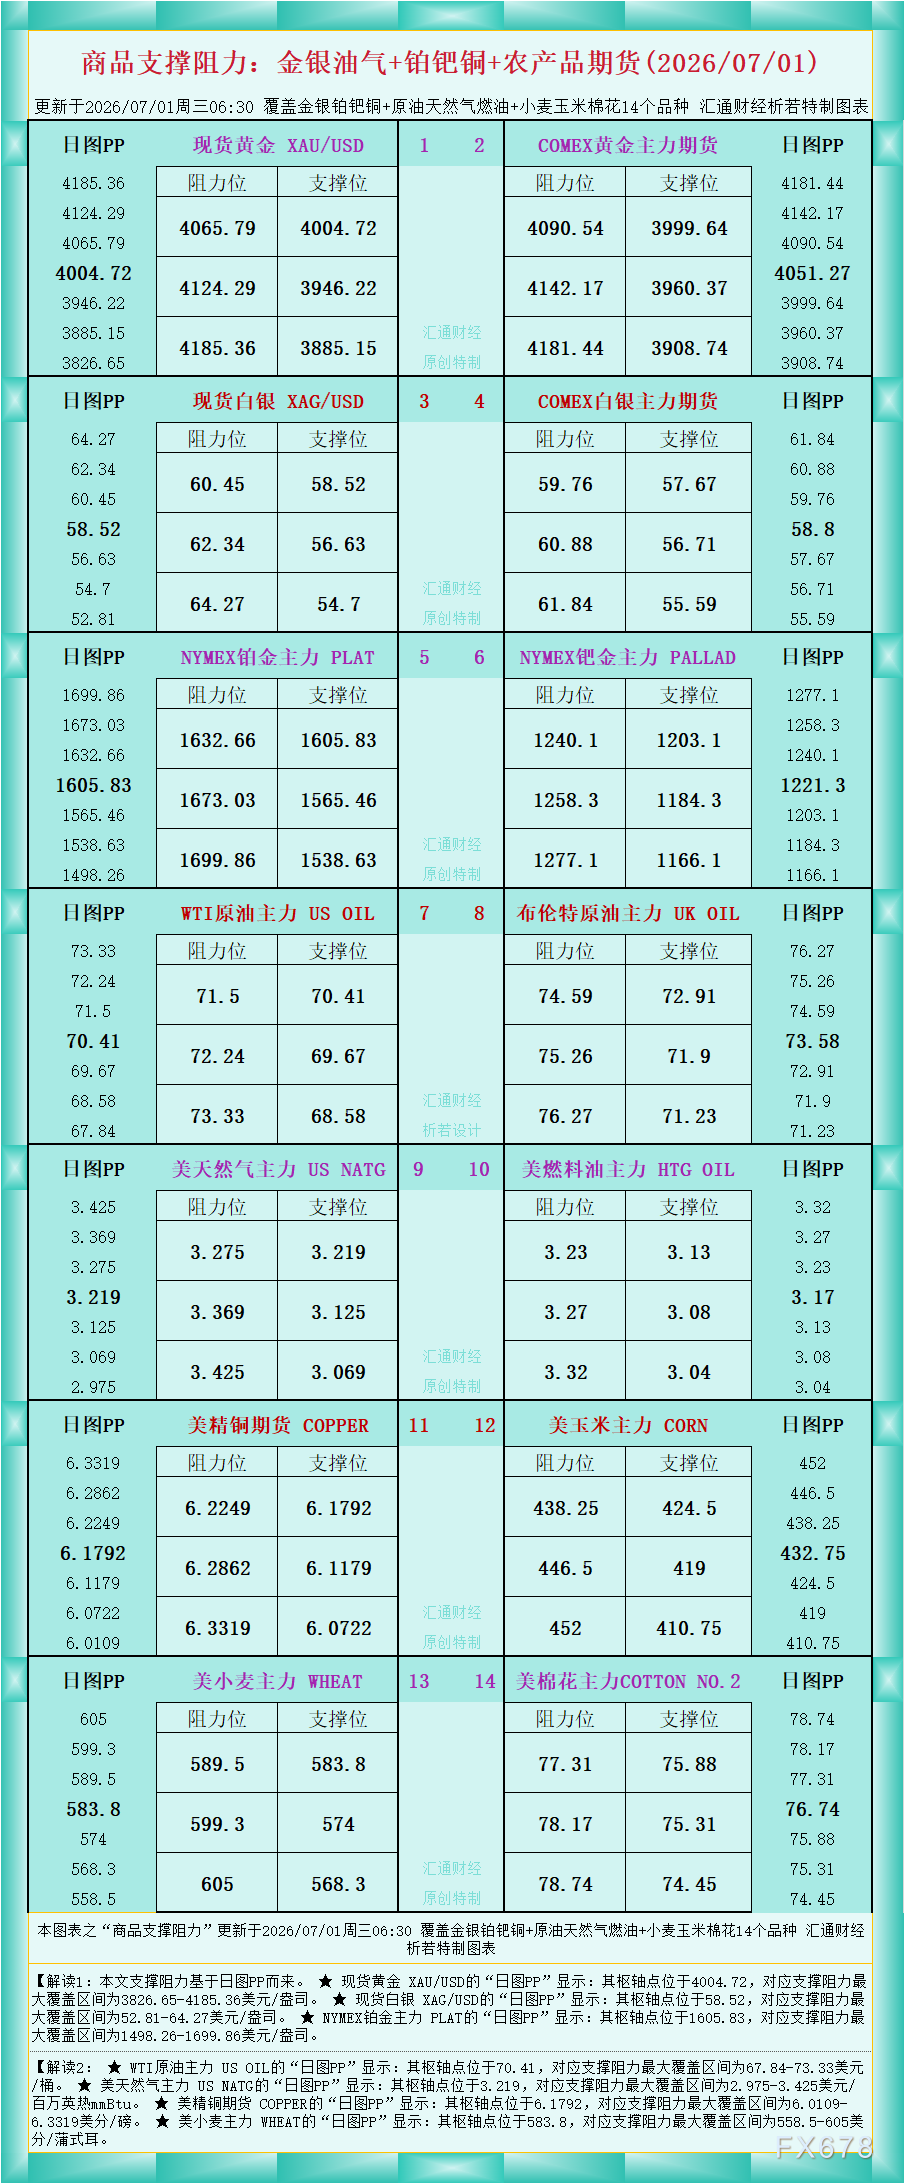
Interpretation from the chart data, Analysis 1: The support and resistance in this article are based on the Daily PP.
★ Spot gold XAU/USD “Daily PP” shows: its pivot point is at 4004.72, with the maximum support and resistance range at 3826.65-4185.36 USD/oz.
★ Spot silver XAG/USD “Daily PP” shows: its pivot point is at 58.52, with the maximum support and resistance range at 52.81-64.27 USD/oz.
★ NYMEX platinum main contract PLAT “Daily PP” shows: its pivot point is at 1605.83, with the maximum support and resistance range at 1498.26-1699.86 USD/oz.
Interpretation 2:
★ WTI crude oil main contract US OIL “Daily PP” shows: its pivot point is at 70.41, with the maximum support and resistance range at 67.84-73.33 USD/barrel.
★ US natural gas main contract US NATG “Daily PP” shows: its pivot point is at 3.219, with the maximum support and resistance range at 2.975-3.425 USD/million BTU.
★ US copper futures COPPER “Daily PP” shows: its pivot point is at 6.1792, with the maximum support and resistance range at 6.0109-6.3319 US cents/lb.
★ US wheat main contract WHEAT “Daily PP” shows: its pivot point is at 583.8, with the maximum support and resistance range at 558.5-605 US cents/bushel.
For more variety analysis, refer to the chart.
Disclaimer: The content of this article solely reflects the author's opinion and does not represent the platform in any capacity. This article is not intended to serve as a reference for making investment decisions.
You may also like
Musk invokes ‘K2’ as US AI buildout reaches 3.63% of GDP
ONDO and QNT Lead RWA Rally: What’s Driving Today’s Price Action?


UBS: US Companies’ Capex Willingness Rebounds from Bottom, Further Rate Hikes May Have Limited Impact on Economy
UBS believes that traditional U.S. investments have been subdued for a long time and are at a low level, with limited room for further rate hikes to have an impact. Meanwhile, corporate operating cash flow has increased by 25%, providing sufficient internal funds, which may weaken the transmission effect of interest rates on Capex. As capital expenditure willingness rebounds from historic lows and non-AI investments show signs of stabilization, U.S. corporate investment may be entering a recovery phase.

Crypto prices
More


