



Velvet [$VELVET], the AI-powered onchain trading and portfolio terminal, saw yet another bullish catalyst that sent its token’s price soaring. This, after the DeFi platform’s official X handle announced a partnership with Aerodrome Finance.
Velvet routes Base trades directly through Aerodrome, giving users access to deepened liquidity pools while getting tighter pricing and better fills as a result.
This news, alongside the recent bullish price action, has catalyzed $VELVET bulls to drive prices higher once again.
Why the recent gains are in line with $VELVET’s structure
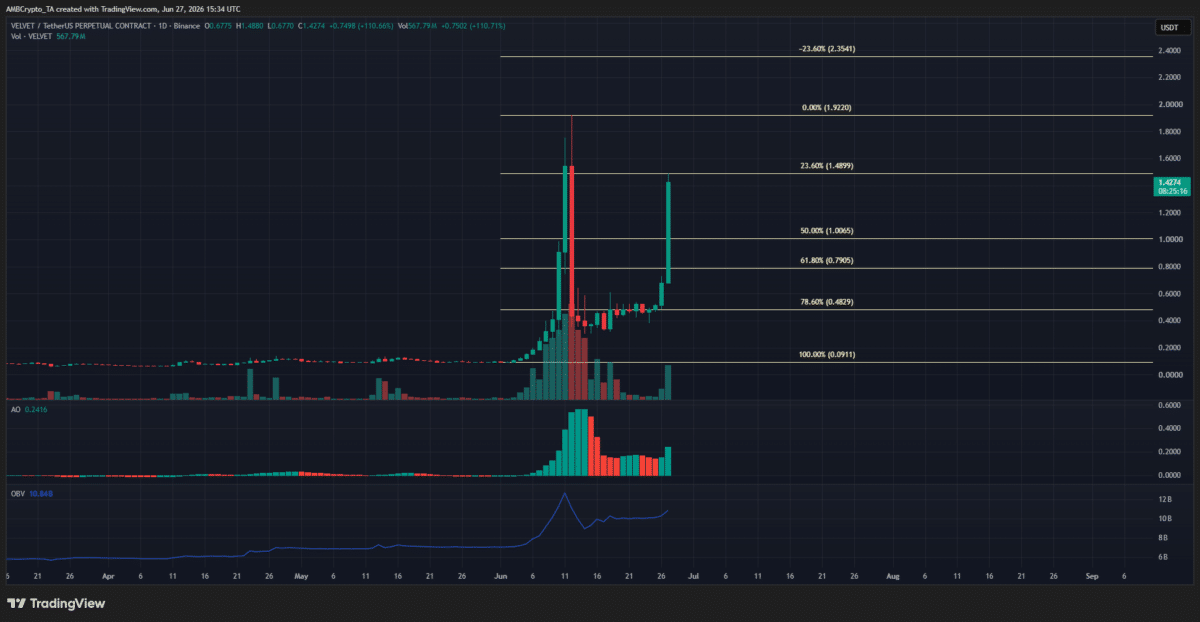
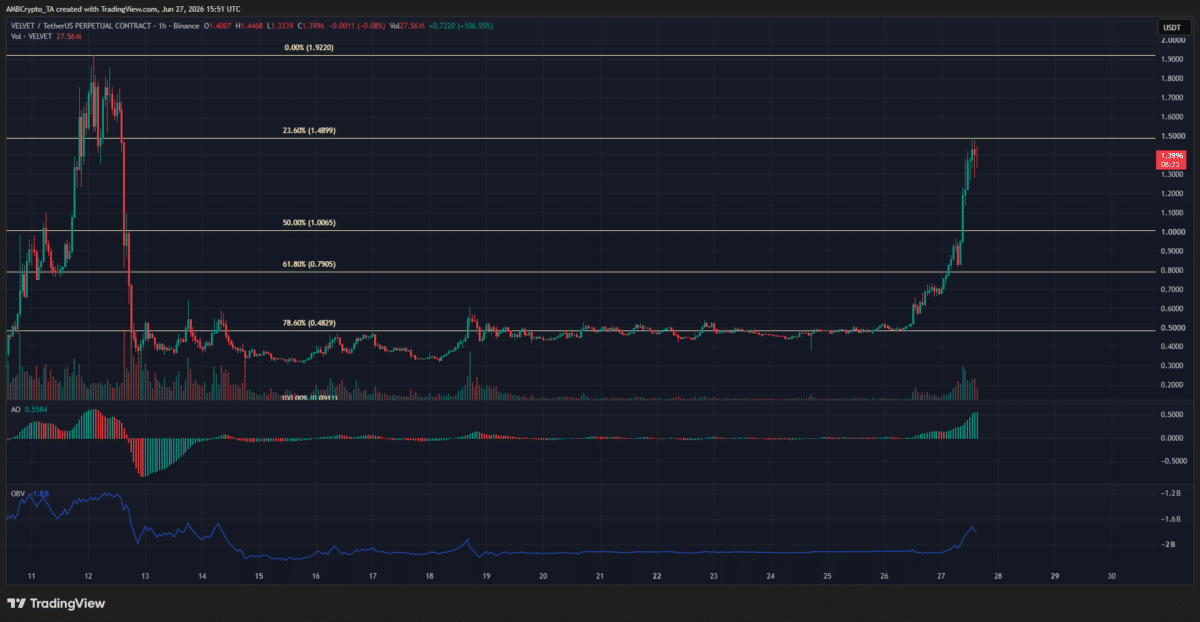
In the last 24 hours, $VELVET has rallied by 135%, with a 382% surge in daily trading volume. This recovery came after the altcoin corrected by 84% in two days, falling from $1.92 to $0.30.
 Source:
$VELVET/
$USDT on TradingView
Source:
$VELVET/
$USDT on TradingView
The crash was astounding, and it sounded all doom and gloom. However, from a technical perspective, it did not break the altcoin’s swing structure on the 1-day chart.
Instead, the price forayed briefly below the 78.6% retracement level at $0.483, before reclaiming the level as support. This reclamation served as a launchpad for the sizeable rally in recent days.
The Awesome Oscillator seemed to be climbing higher too, showing that momentum has remained bullish despite the deep correction. The selling volume did not appear to be as strong either as the OBV did not fall too far from the high made earlier in June.
Traders’ call to action – Remain cautious!
 Source:
$VELVET/
$USDT on TradingView
Source:
$VELVET/
$USDT on TradingView
In the short-term, there is a good argument to be made that following the upward momentum can be profitable. It certainly can be, if the lower timeframe trader knows what they’re doing. Especially in light of this latest update.
The $VELVET market has displayed plenty of volatility at a time when the rest of the market was bleeding. It is natural to suspect the relative strength of this token, taking into consideration the price manipulation allegations other wildly volatile tokens have faced.
Final Summary
- Strong price spike in the last 24 hours was accompanied by a nearly fourfold hike in daily trading volume.
- Relative strength of $VELVET against the wider market has been impressive, but trader and investor caution is warranted.


