
Zcash eyes 15% drop as price approaches critical $400 support

Zcash has erased most of its mid-June recovery, bringing the privacy coin back to a major support zone as sellers regain control.
- Zcash has fallen about 15% from recent highs as traders continue reacting to the Orchard vulnerability fallout.
- Technical indicators show growing downside risk, with the key $400 support level now under pressure.
- CoinGlass liquidation data highlights major resistance near $430, while a break below $400 could open the door to $343-$350.
According to crypto.news data, Zcash (ZEC) traded near $412 on June 24, down roughly 15% from its June 18 high around $500. The retreat comes weeks after developers revealed a critical soundness flaw in Zcash’s Orchard shielded pool that theoretically could have allowed undetectable supply inflation.
Although the issue was patched through an emergency upgrade, uncertainty surrounding whether the flaw had ever been exploited continues to weigh on sentiment.
Selling pressure has accelerated as investors reassess long-term trust in the privacy-focused cryptocurrency. The disclosure prompted several high-profile holders to reduce exposure, including former ZEC supporter Arthur Hayes, who confirmed earlier this month that he had exited his position.
Despite a sharp rebound toward $500 following the initial panic, buyers have struggled to maintain momentum above major resistance levels.
At the same time, conditions across the crypto market remain unfavorable. Bitcoin’s recent breakdown below key support zones triggered widespread liquidations across derivatives markets and reduced risk appetite among traders.
Capital has continued flowing toward yield-generating assets and artificial intelligence-related equities, while expectations for prolonged higher interest rates have strengthened demand for traditional safe-haven investments.
Technical breakdown puts $400 support in focus
The four-hour chart shows Zcash losing momentum after failing to hold above the 0.618 Fibonacci retracement level at approximately $494. Price has since fallen back toward the 0.382 retracement support near $401, which now represents the most important level for bulls to defend.
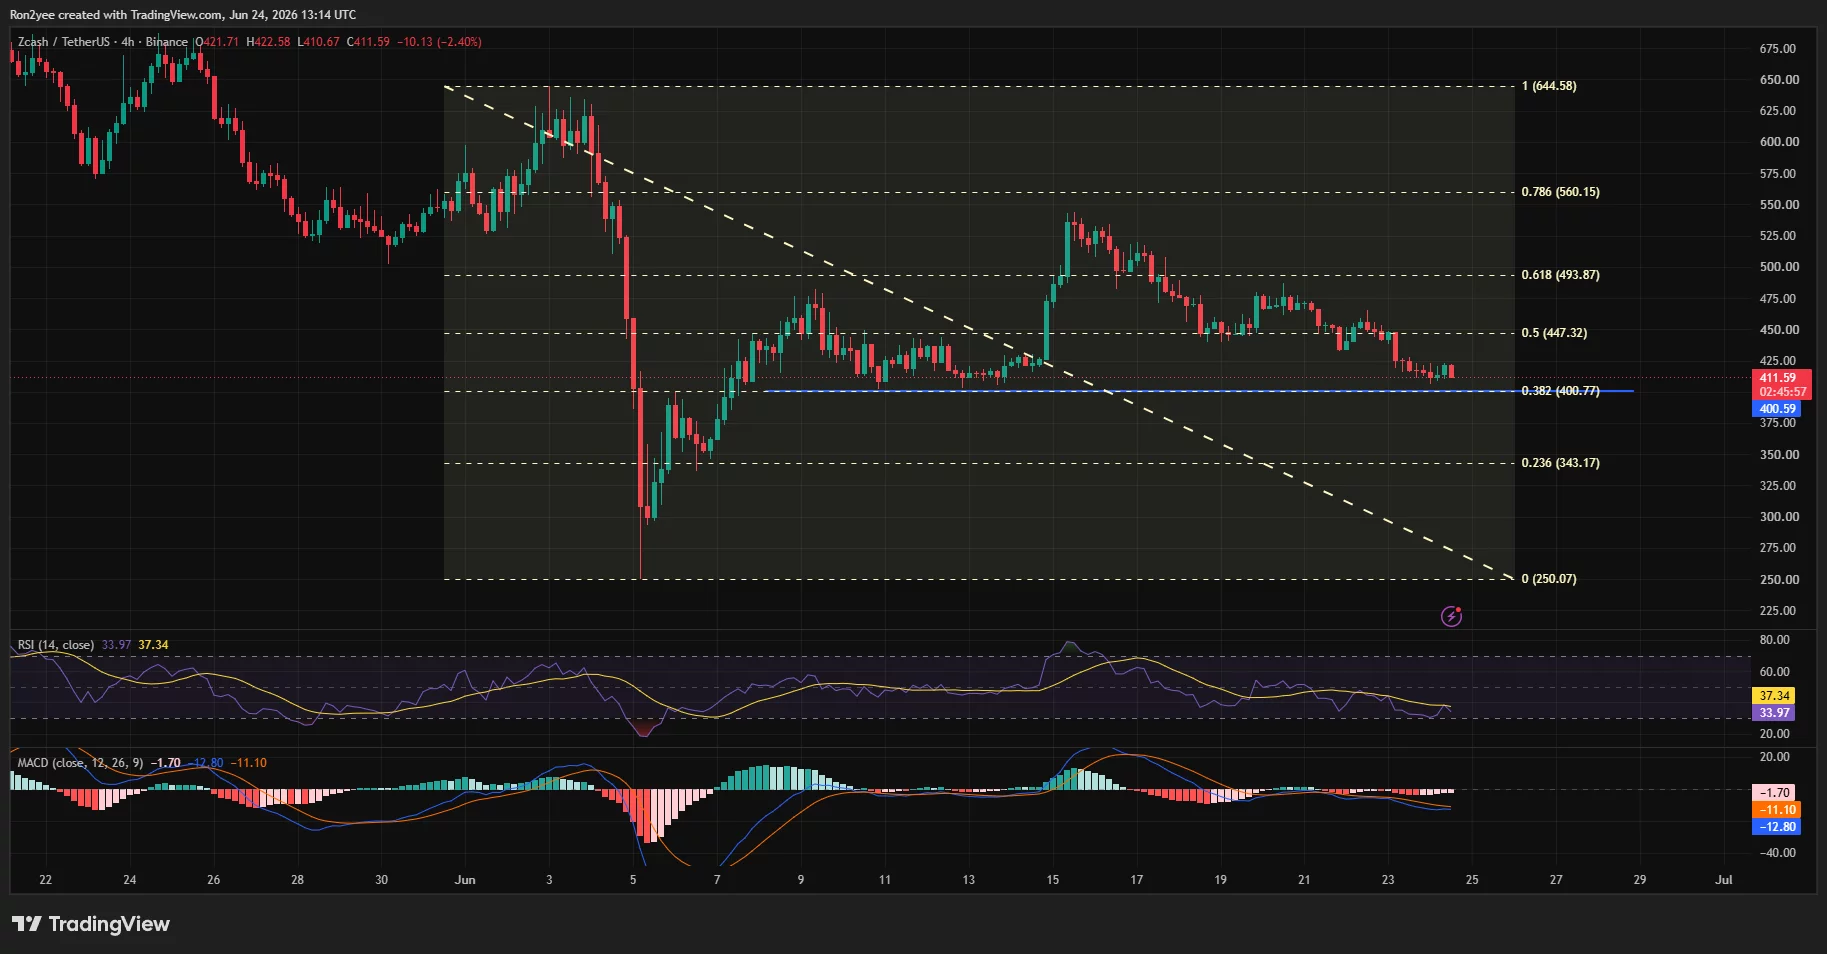 Zcash 4-hour price chart — June 24 | Source:
crypto.news
Zcash 4-hour price chart — June 24 | Source:
crypto.news
A descending trendline drawn from the June highs remains intact, reinforcing the sequence of lower highs established since the post-crash recovery peaked near $540.
A break below the $400-$401 region would expose the next major Fibonacci support near $343, representing a potential decline of roughly 15% from current levels.
Momentum indicators continue to favor sellers. The 14-period Relative Strength Index has dropped to around 34, placing it near oversold territory but still below the neutral 50 level. Meanwhile, the MACD remains in bearish alignment, with both signal lines below zero and histogram bars expanding in negative territory.
Market participants are increasingly focused on the $400 area. Commenting on the matter, crypto analyst Altcoin Sherpa warned that a breakdown could trigger another leg lower.
“$ZEC better pray that $400 can hold or we’re seeing $350 imo.”
The analyst added that exponential moving averages on the four-hour timeframe remain firmly bearish despite the magnitude of the recent decline.
Liquidation clusters reinforce resistance near $430
Derivatives positioning also presents challenges for any recovery attempt. CoinGlass liquidation data shows the largest concentration of leveraged positions sitting between $427 and $430, creating a significant overhead resistance zone where short-term rallies could encounter heavy selling pressure.
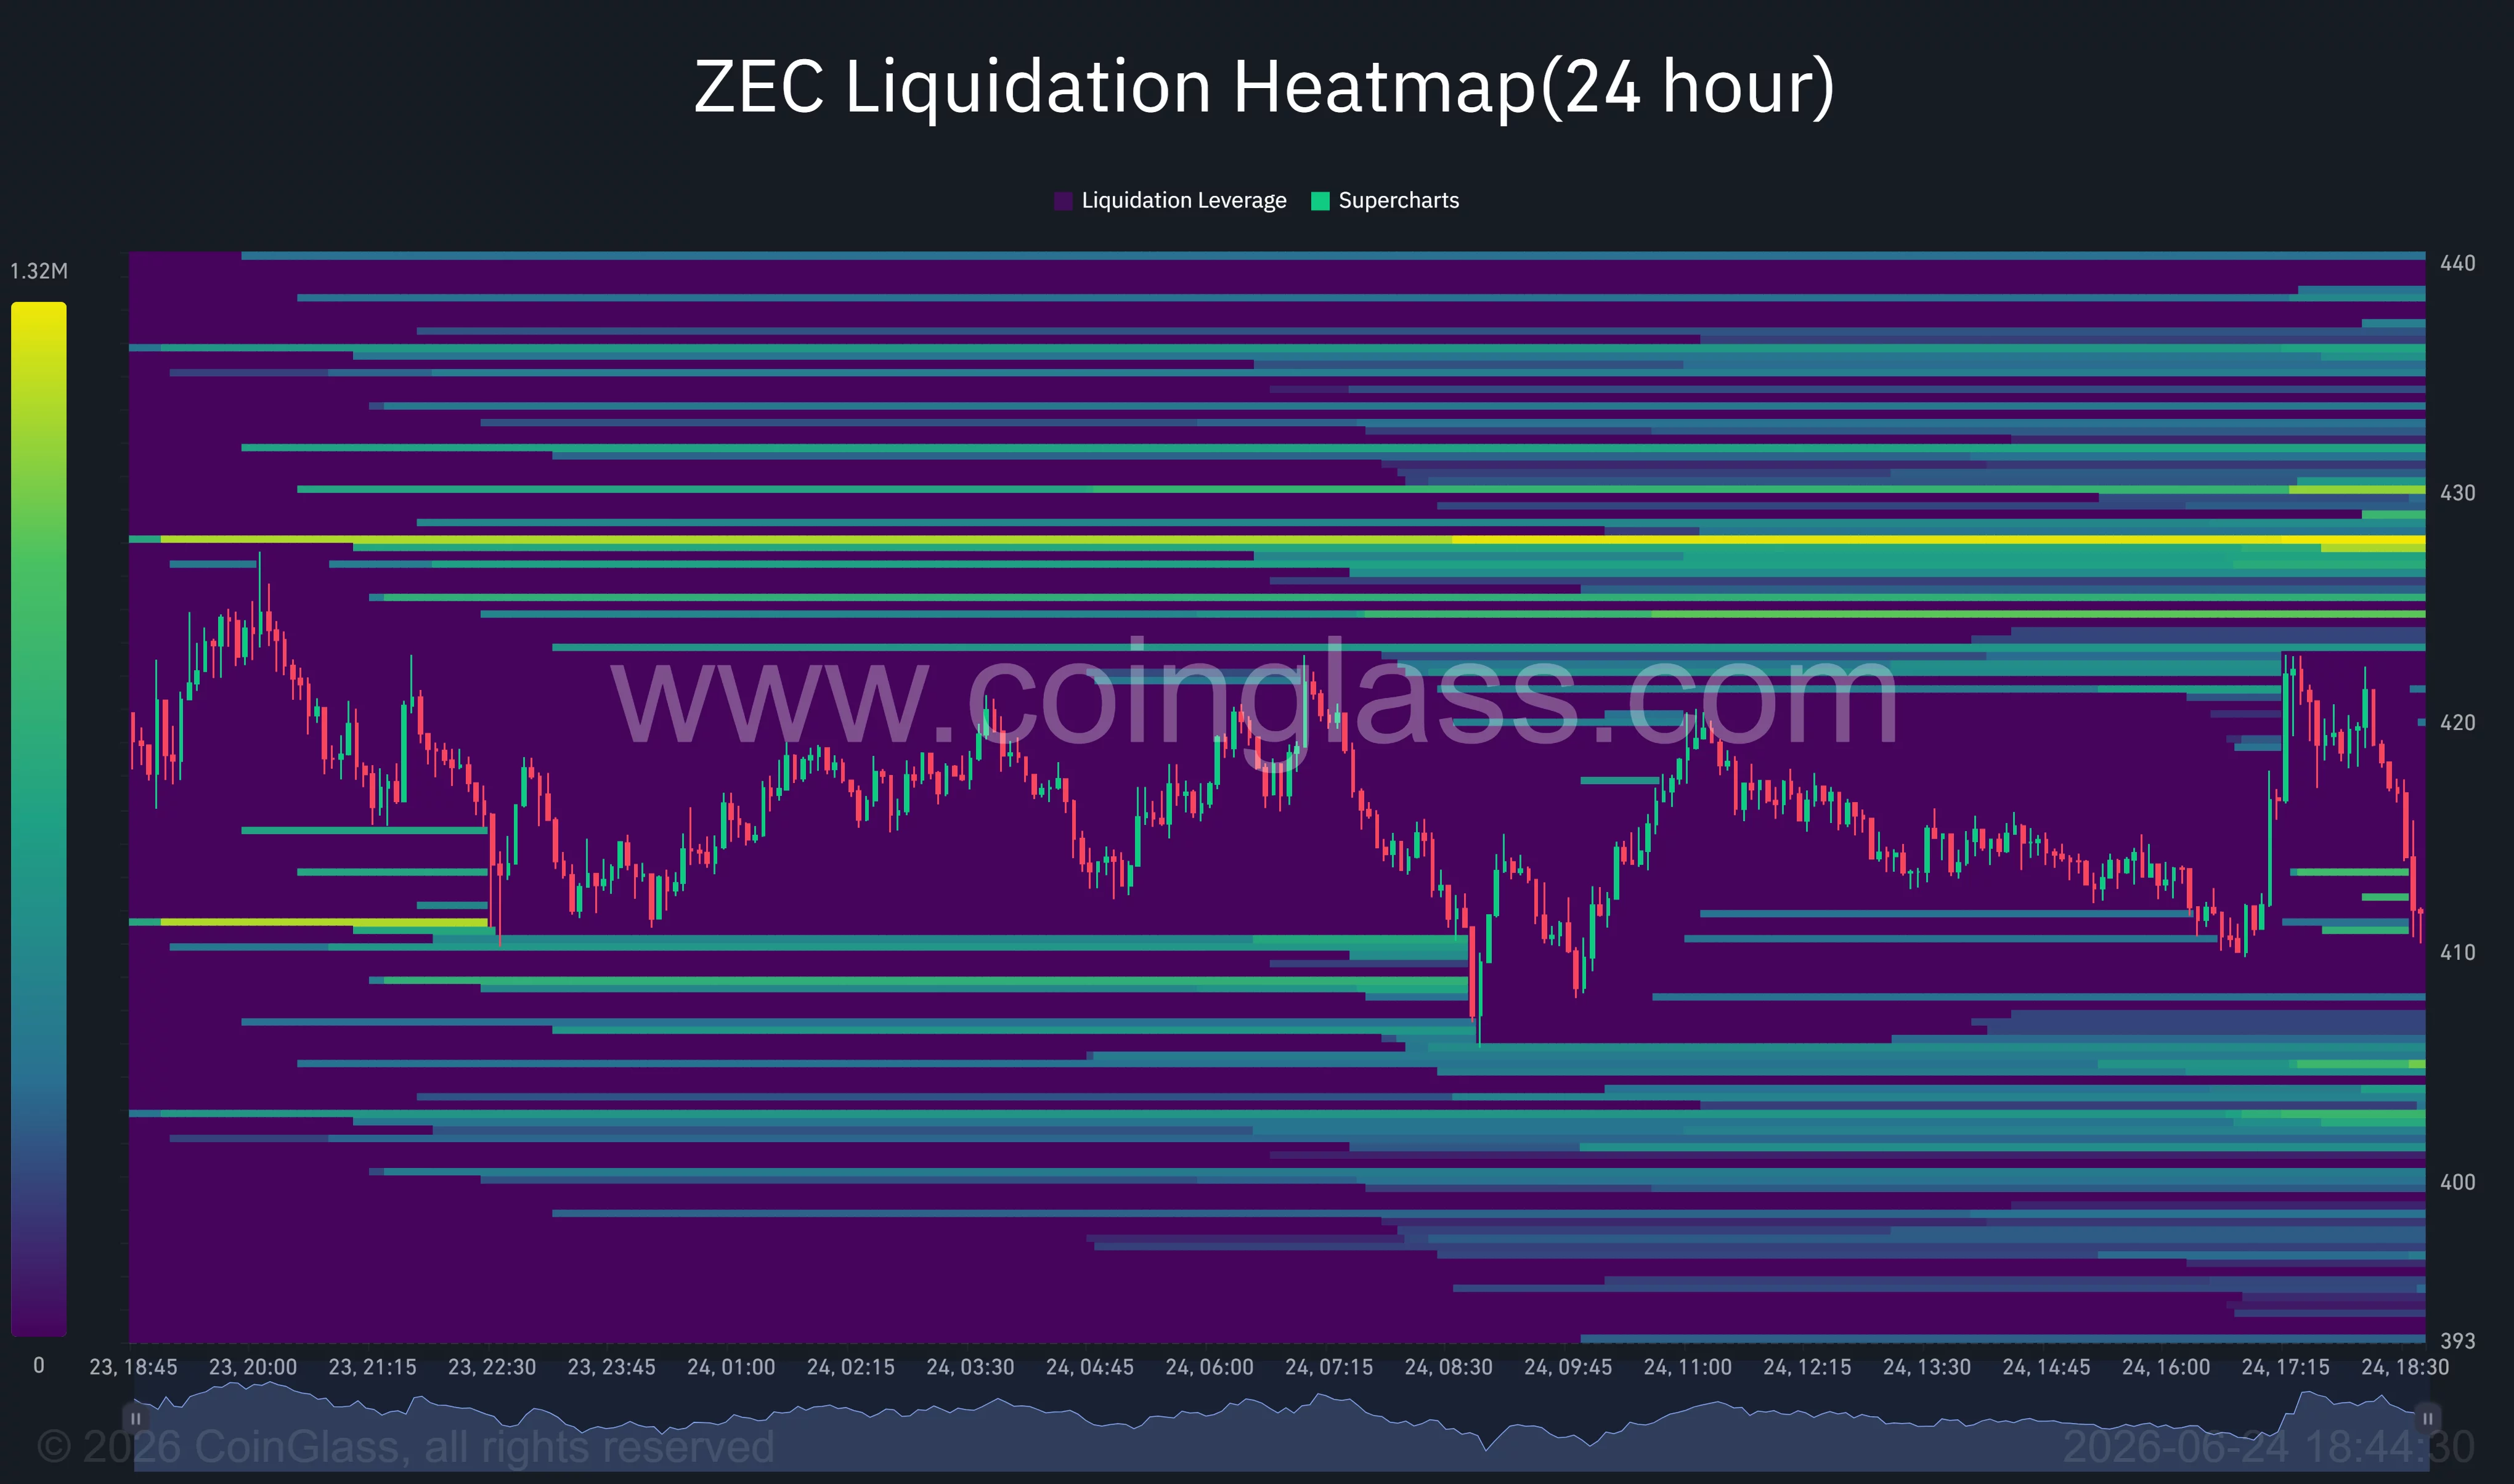 Zcash liquidation heatmap | Source:
CoinGlass
Zcash liquidation heatmap | Source:
CoinGlass
Additional liquidity clusters are visible around $440, while nearby support pockets have formed between $405 and $410. The concentration of liquidation levels above the current price suggests many traders have opened bearish positions during the recent decline, increasing the likelihood of volatility around those zones.
Open interest has remained elevated despite falling prices, a combination that often accompanies fresh short positioning rather than long accumulation. The long-short balance has also deteriorated in recent sessions as traders continue betting on further downside.
Unless Zcash can reclaim the $430 region and invalidate the current lower-high structure, attention is likely to remain fixed on the $400 support level.
A decisive break below that threshold would place the $350-$343 area at the center of traders’ downside targets heading into the final week of June.
Disclaimer: The content of this article solely reflects the author's opinion and does not represent the platform in any capacity. This article is not intended to serve as a reference for making investment decisions.
You may also like
Why suspend RMPs? Explanation from New York Fed SOMA Manager Perli
"Agent vs US Treasury" — Who Will Dominate the US Stock Market?
The wave of AI Agents and US Treasury yields are splitting the US stock market into two worlds: Meta's release of the Muse model boosted its market value by $220 billion in a single week, propelling the Nasdaq's standout performance; however, excluding AI stocks, the S&P 500 actually fell 1% this week, with the number of new lows on the New York Stock Exchange surpassing new highs for nine consecutive days, signaling the near end of "breadth trading." Goldman Sachs bluntly stated that this is a "frustrating cat-and-mouse game" between the stock market and interest rates—any breakout can be snuffed out by the bond market at any time, so equity holders must short US Treasury bonds to hedge simultaneously.
Hopes for a ceasefire between the US and Iran encounter obstacles again! Trump rejects Iran's seven-day proposal; inflation pressure under $100 oil prices remains difficult to ease
Trump rejects a ceasefire with Iran, and it is expected that bombings will occur again after the midterm elections. The president doubts whether Tehran will meet his demands.
Tesla ramps Optimus production 10-fold but robot hands are holding Elon back
Crypto prices
More


