ambcrypto.com
Ethena [$ENA] attracted fresh attention after gaining 4.34% to trade at $0.0941. Trading volume also surged 69.15% to $149 million.
The recovery coincided with a sharp increase in network activity. Daily Active Addresses climbed to 5,057, their highest level since November 2025.
The rise in participation suggested growing engagement across the Ethena ecosystem despite $ENA’s prolonged decline from late-2025 highs.
Can $ENA complete its bullish reversal pattern?
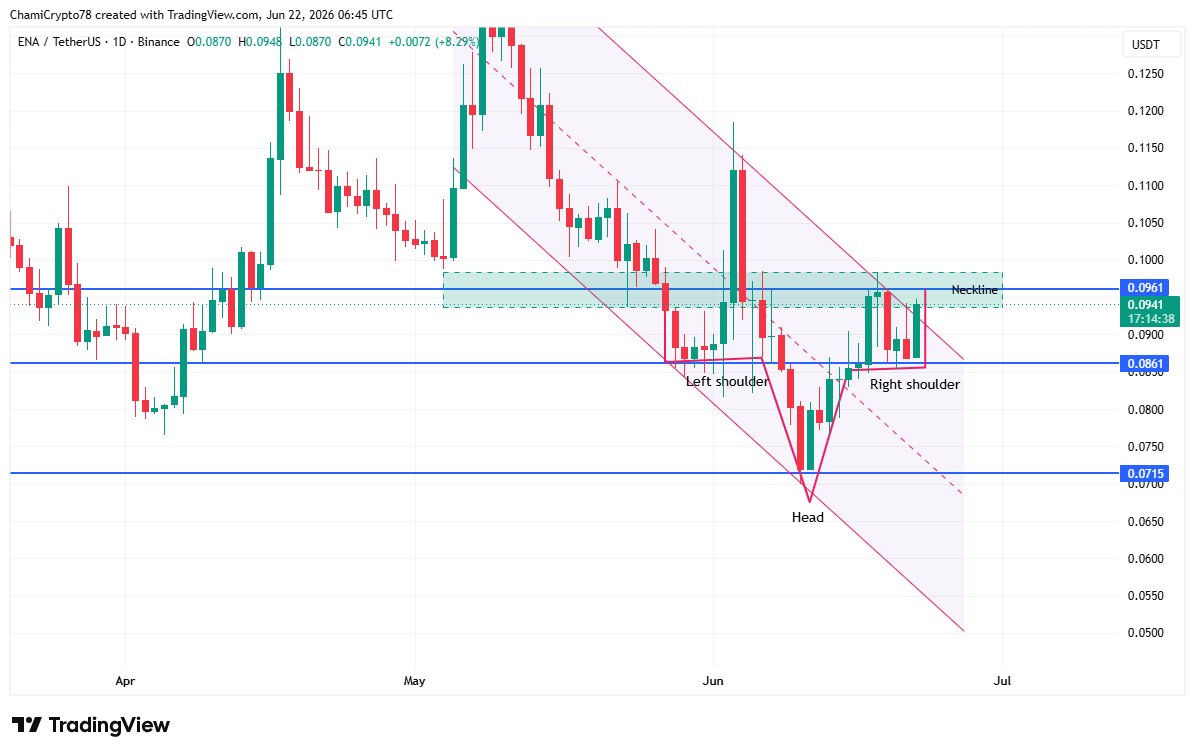
As for Ethena price prediction, $ENA formed an inverse head-and-shoulders pattern after finding support near $0.0715 and building higher lows around $0.086. At the same time, the token broke out of a descending channel that had capped price action since early May.
Buyers defended the right shoulder and pushed $ENA back toward the neckline resistance at $0.096. That recovery strengthened the bullish structure and placed greater focus on the current resistance zone.
Price also remained above right-shoulder support despite multiple rejections near the neckline.
A breakout above $0.096 could pave the way toward the psychological $0.10 level. That level may also shape the next phase of the Ethena price prediction as traders look for confirmation of a broader trend reversal.
However, sellers continued defending the area, leaving the setup dependent on a decisive close above resistance.
 Source: TradingView
Indicators strengthen the bullish structure
Technical indicators are increasingly aligned with the improving price structure.
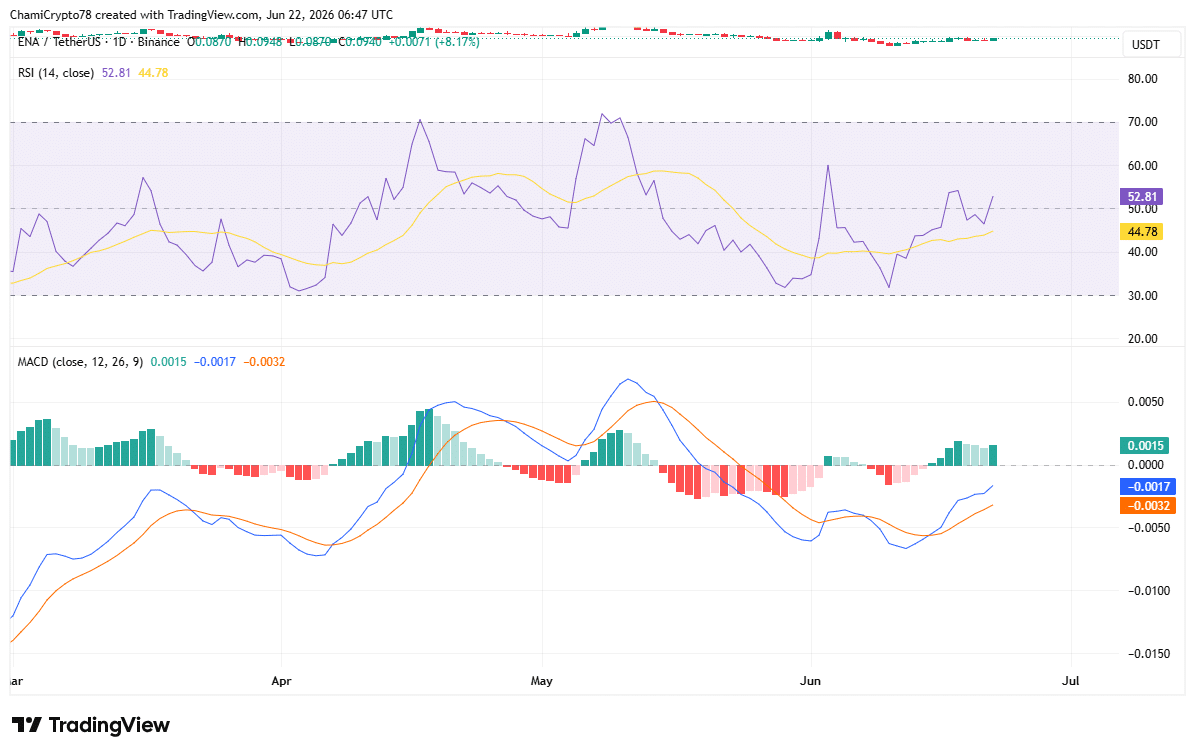
The Relative Strength Index [RSI] rose to 52.81 and moved above its moving average at 44.78. This suggested buying pressure strengthened during the recent recovery.
Rather than remaining below neutral territory, RSI held above 50 and reflected improving momentum.
Meanwhile, the MACD flashed a bullish crossover. The MACD line climbed to 0.0015 and remained above the signal line at -0.0017.
On top of that, the histogram continued printing positive bars, indicating bullish momentum expanded in recent sessions.
Neither indicator entered overbought territory. Even so, both supported the case for further upside if buyers cleared the $0.096 neckline.
 Source: CoinGlass
Where could liquidations drive the next move?
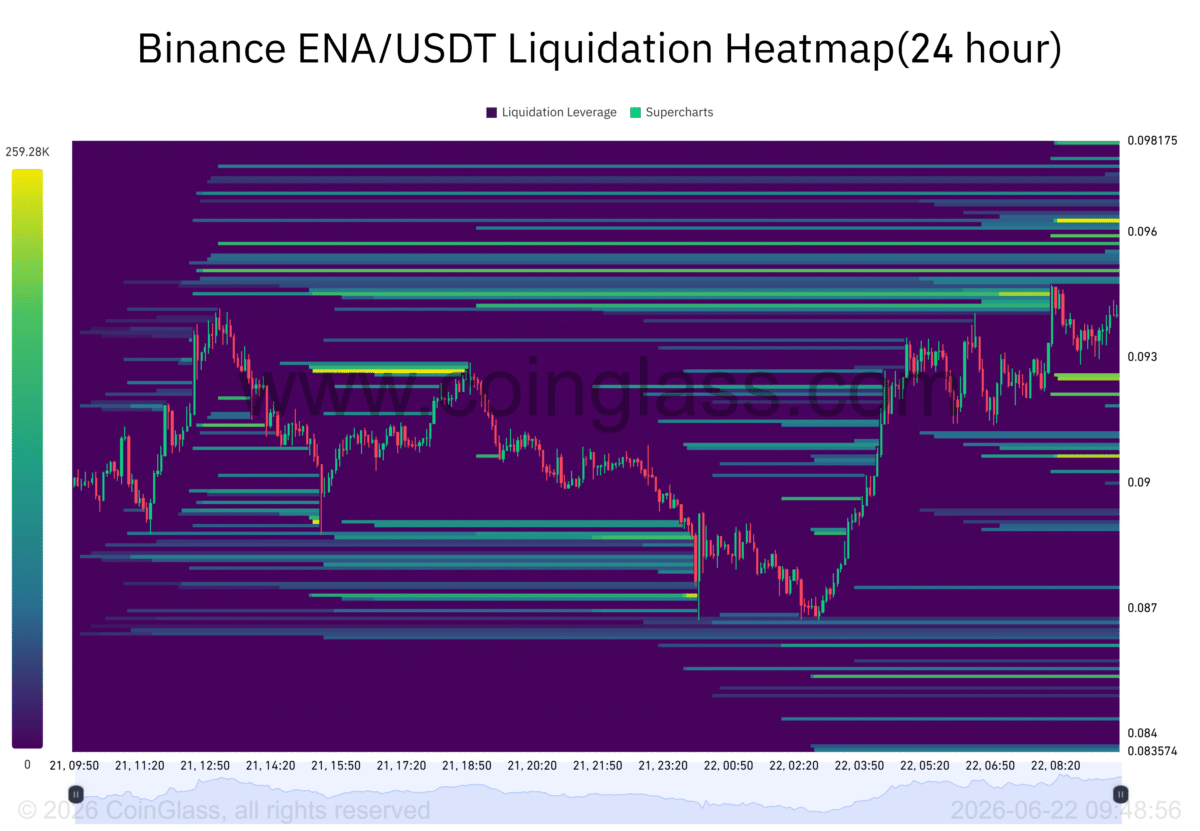
Liquidation data highlighted several zones where leveraged positions remained concentrated. The largest liquidity cluster sat between $0.096 and $0.098, directly above current price action.
That concentration suggested a move into the region could trigger short liquidations and amplify volatility.
As a result, traders continued watching the area closely as $ENA approached resistance.
Below the market, additional liquidity pockets appeared near $0.092 and $0.089. These levels could attract price if sellers regained control.
 Source: CoinGlass
The Liquidation Heatmap showed liquidity stacked on both sides of the price, suggesting traders increased exposure around current levels.
With liquidity building above and below the market, Ethena [$ENA] appeared positioned for a volatility-driven move as buyers and sellers battled around neckline resistance.
Final Summary
- Ethena gained 4% as Daily Active Addresses reached their highest level since November 2025.
- $ENA approached key resistance at $0.096, where a breakout could strengthen the bullish reversal setup.