
Energy ignites a debt market "liquidation" storm: 99.70 becomes the US dollar ceiling? Gold's 5050 defensive line in jeopardy

Huitong Network, March 9—On Monday (March 09), the global financial market was at the center of a liquidity rebalancing storm triggered by dramatic volatility in energy prices. The core driver of the current market is no longer simply inflation expectations, but rather a complex web interwoven by US Treasury liquidity premium, spillover of risk aversion, and global central bank policy divergence.
On Monday (March 09), the global financial market was at the center of a

Bond Market Liquidity Stress and the Underlying Logic of Dollar Pricing
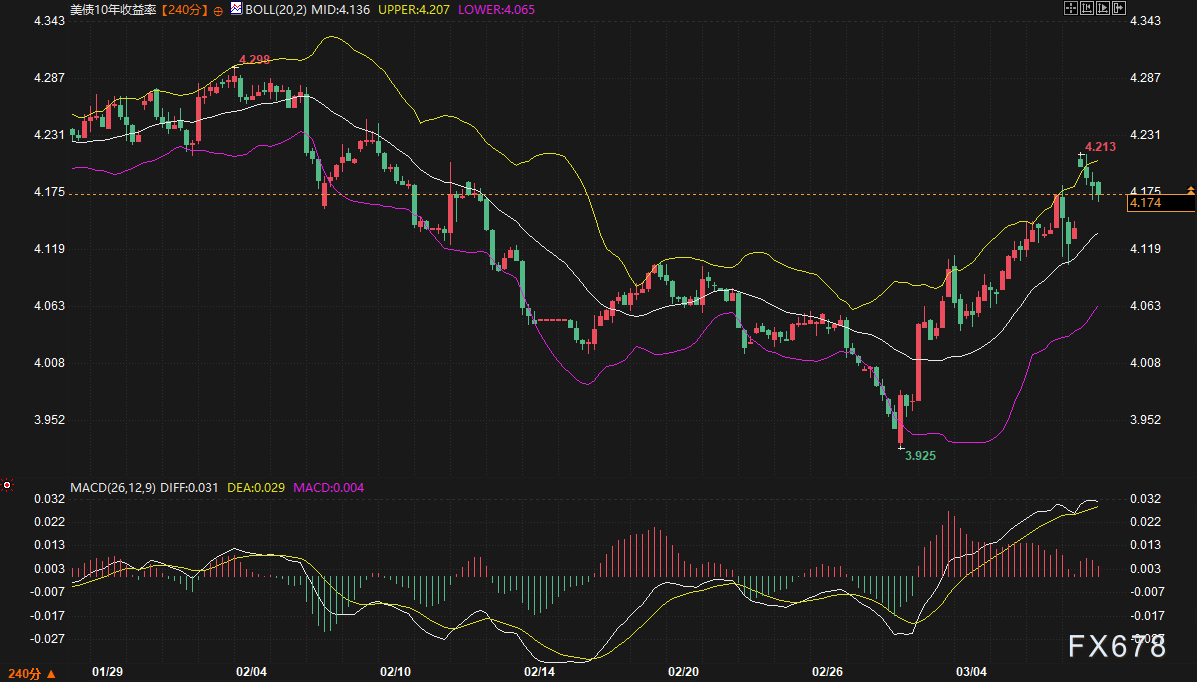
Under the current macro environment, the dollar’s trend is highly anchored to the supply and liquidity structure of the US Treasury market. According to the latest market quotes,
From a fundamental perspective, the rise in Treasury yields is not simply the result of optimism over economic growth, but rather
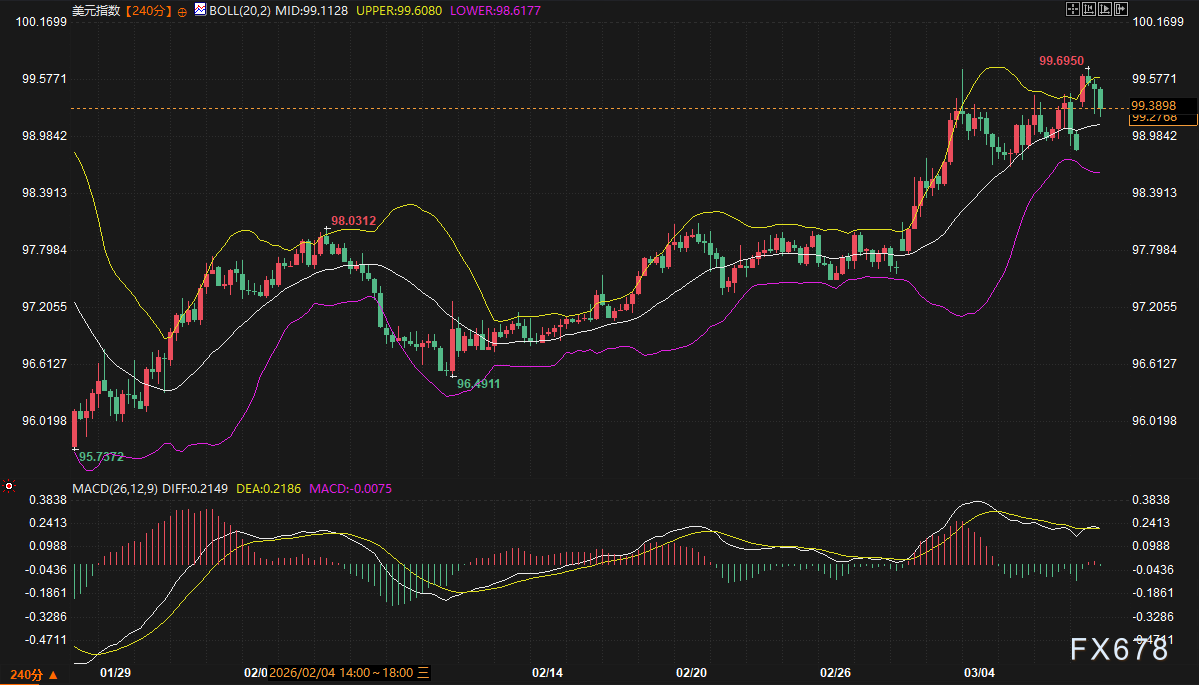
From a technical perspective, the US Dollar Index (DXY) currently stands at 99.3898. Although in a pullback phase from the highs, it is still trading above the middle Bollinger Band. Notably, the 240-minute
The Hedging Logic for Gold Amidst Bond Market Transmission: From Inflation Hedge to Liquidity Defense
Traditionally, rising Treasury yields would suppress gold, but in the current context of “clouds of war,” gold’s pricing logic is undergoing a profound shift from
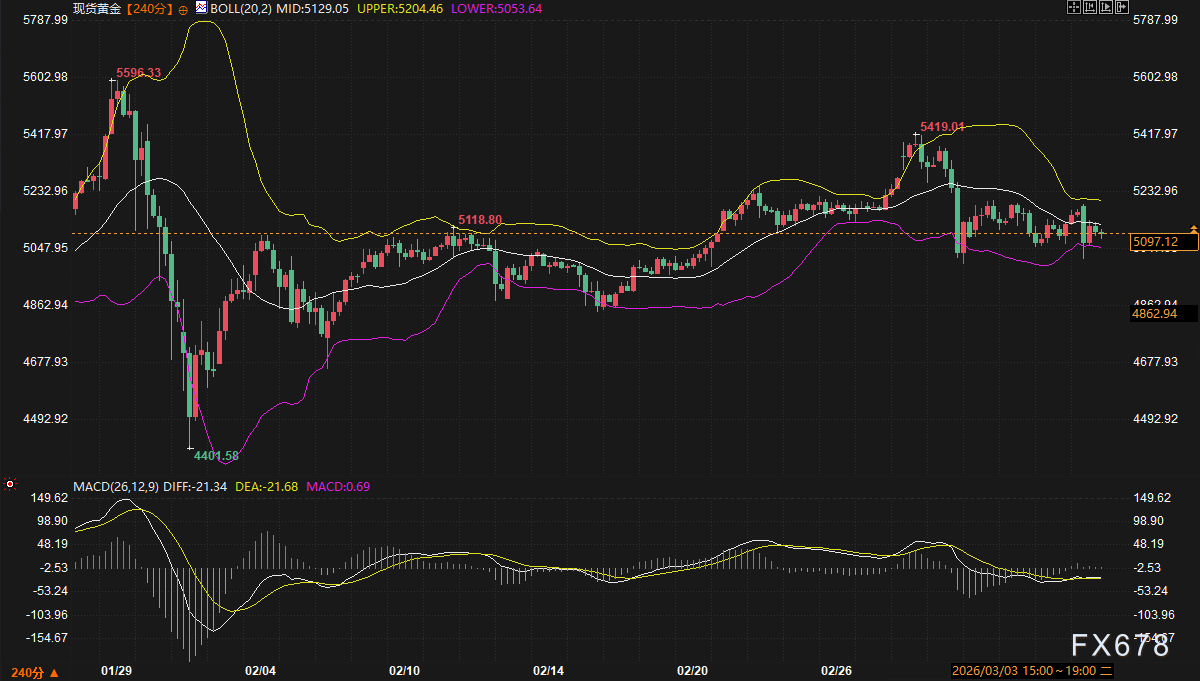
Currently, spot gold is quoted around $5,097.12 per ounce. Although slightly off the peak from early March, its strong support near $5,050 essentially stems from safe-haven demand triggered by bond market turbulence. When 10-year Treasury yields rise rapidly, global investor worries over the stability of European and emerging market sovereign debt mean not all funds flow into safe-haven currencies; some stay in gold, a classic
Forecast for the Next 2–3 Days and Key Technical Levels
In the coming 2–3 trading days, the market will enter a “post-impulse normalization” period, but volatility will remain elevated.
Summary & Outlook
The current market game is in a highly sensitive vacuum phase. On one hand,
FAQ
Answer: The transmission occurs along two paths. First, the “inflation expectation” channel—crude oil as the mother of commodities, sees price surges push forward inflation compensation (Break-even Inflation) higher, lifting nominal treasury yields and increasing dollar appeal. Second, the “safe-haven liquidity” channel—when the energy landscape deteriorates, and investors turn pessimistic on non-US economies (especially Europe, heavily dependent on imports), capital flows into US Treasuries for safety. Should oversupply spark a bond selloff, rising yields increase the dollar’s funding cost and reinforce its strong stance.
Answer: In normal cycles, Treasury yields and gold are inversely correlated. But in crisis modes, both can climb together. The core logic now driving gold is “hedging systemic risk.” When the Treasury market itself is volatile due to liquidity shortages (e.g., GC rates climbing) or elevated credit risk premiums (such as UK and French bonds), investors no longer see bonds as absolutely safe. At that point, gold’s “ultimate safe-haven asset” attribute is triggered. As long as risk premium from geopolitics outweighs the holding cost from higher real rates, gold can remain resilient or even strengthen.
Answer: A 240-minute MACD death cross usually signals a temporary exhaustion in a medium-term uptrend. This means the one-sided rally fuelled by geopolitical panic of recent weeks may be pausing, shifting to a phase of consolidation near the highs. Given support from the middle Bollinger at 99.11, this death cross is more about “time for space”—a minor pullback, not a genuine trend reversal. It sends a message: absent fresh extreme news, the 99.70 level is now a commonly agreed short-term top.
Answer:
Answer: The crucial signal is
Disclaimer: The content of this article solely reflects the author's opinion and does not represent the platform in any capacity. This article is not intended to serve as a reference for making investment decisions.
You may also like
Quarterly Report Misses Expectations, Revenue Stagnates! Nike Announces New Round of Layoffs, Stock Price Nearly Halved This Year in "Worst-Ever" Performance | Earnings Report Insight
Nike’s quarterly revenue fell by 4% year-on-year, and its full-year guidance is far below expectations, with earnings per share projected at only $1.15-$1.35, much lower than analysts’ estimate of $1.68. The new layoff plan “Pace” aims to save $2.5 billion by 2031. Wall Street’s rating has dropped to a 25-year low, Bank of America set a target price of just $30, and sales recovery is now expected to be delayed until 2028.
Silver Price Forecast: XAG/USD slips below $60.50 amid rising inflation concerns
A "Calm on the Surface" US Stock Market: Indexes Are "One Step Away" from New Highs, but Almost All Sectors Have Been Hit Hard
The yield on the 10-year U.S. Treasury has risen to 5.34%, quietly tearing apart the market: the S&P 500 is less than 2% away from its all-time high, but the median decline among S&P 500 components over the past month is 5%, and the equal-weight index has fallen for seven consecutive weeks. More than one-third of small-cap stocks have become "zombie companies," bank stocks have dropped more than 12% from their peak, and utilities are just one step away from a bear market. The only current support comes from AI tech giants—if AI profit expectations collapse, the risk of a broad market meltdown currently masked will erupt instantly.

Crypto prices
More


