
Bitcoin trader sees 'lower soon' as BTC price starts to erase $74K breakout

Bitcoin (BTC) gave back some gains at Thursday’s Wall Street open as traders hoped that bidders would step up.
Key points:
Bitcoin begins to lose ground after hitting $74,000, now targeting a potential support reclaim.
Bid support remains strong on exchanges in an encouraging signal for trend reversal.
Bearish BTC price forecasters remain confident about the rally fizzling.
Bitcoin bulls run out of steam at monthly highs
Data from tracked 1.5% BTC price downside on the day as the market fell further from $74,000 local highs.
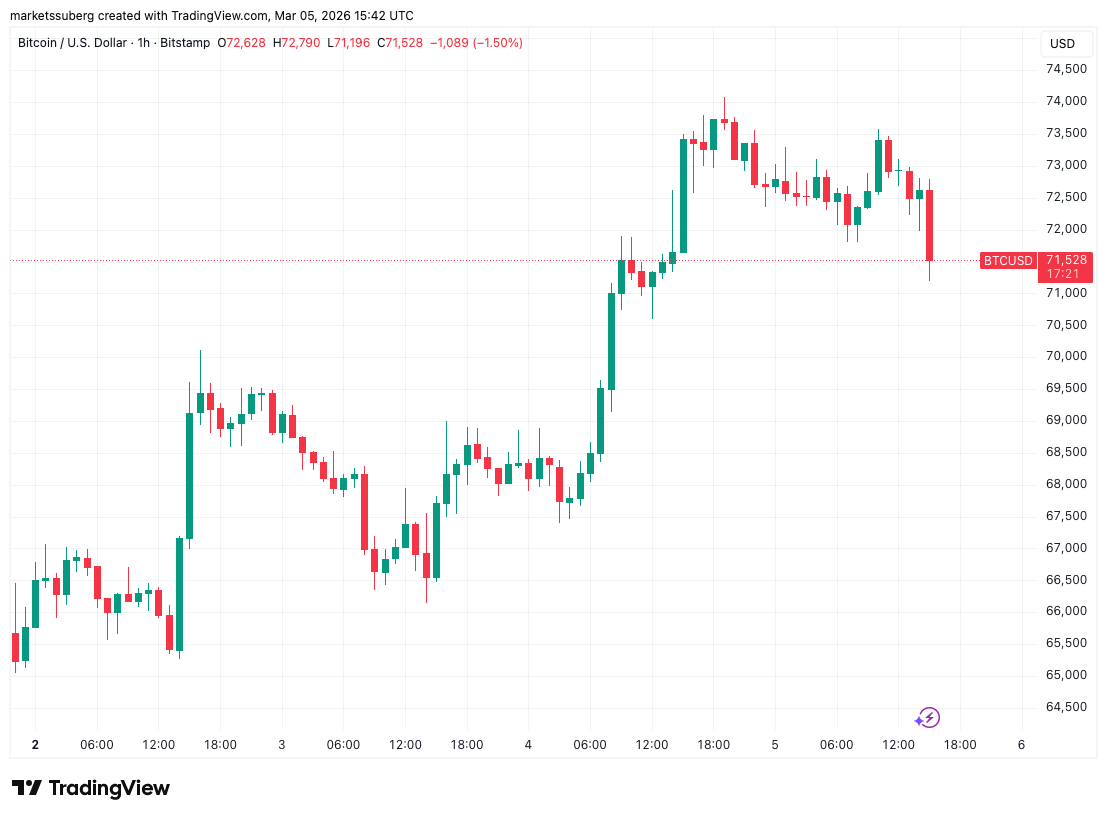 BTC/USD one-hour chart. Source: Cointelegraph/TradingView
Now in the process of testing key long-term levels as potential new support, BTC enjoyed waning sell-side pressure on crypto exchanges.
“Binance spot orderbook depth has quite strong bid side, OB imbalance also not as negative as it should be, so staying bullish,” X commentator Exitpump wrote in its latest analysis.
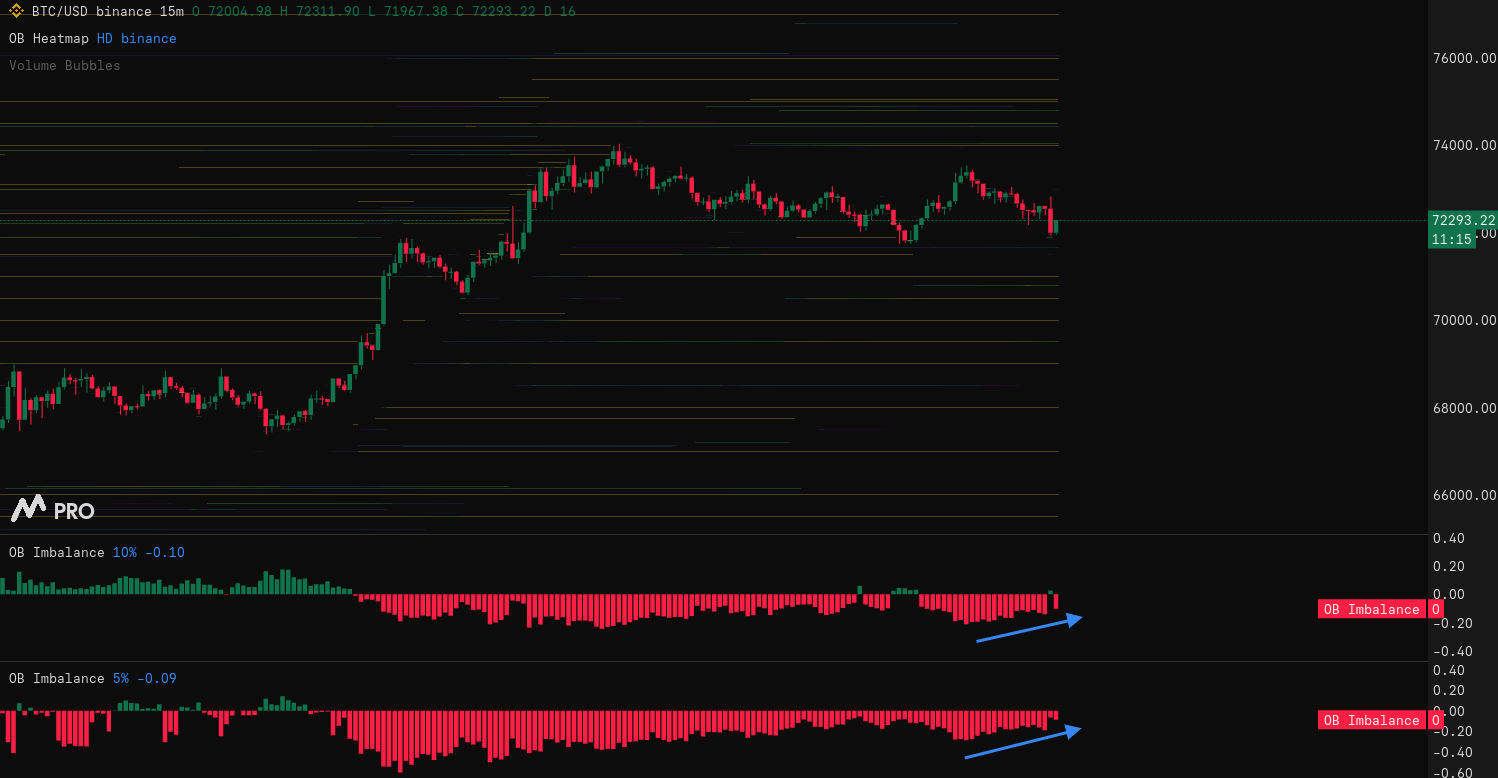 BTC/USD 15-minute chart with Binance order-book data. Source: Exitpump/X
Trader Castillo Trading noted improving conditions on longer time frames.
“Binance spot $BTC sell pressure has really cooled off this month,” they summarized while comparing activity across major exchanges.
“Very interesting dynamic to see as it really seems they aren't suppressing price anymore. Of course I am sure selling pressure can come back quickly but overall, this is what we want to see.”
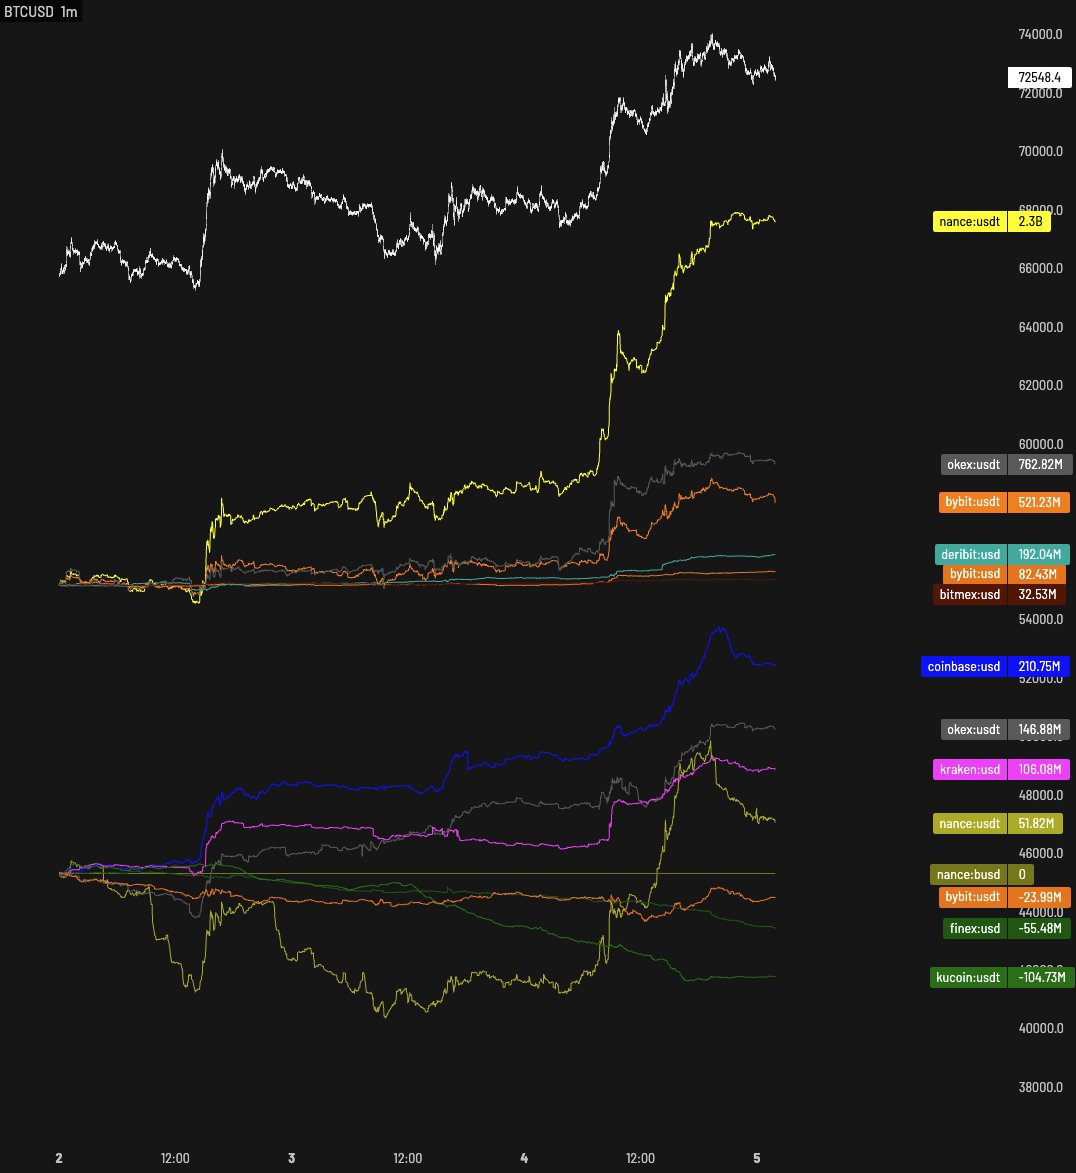 BTC/USD one-minute chart with exchange activity. Source: Castillo Trading/X
The latest data from monitoring resource showed price slicing through bid liquidity located immediately above the $71,000 mark at the time of writing.
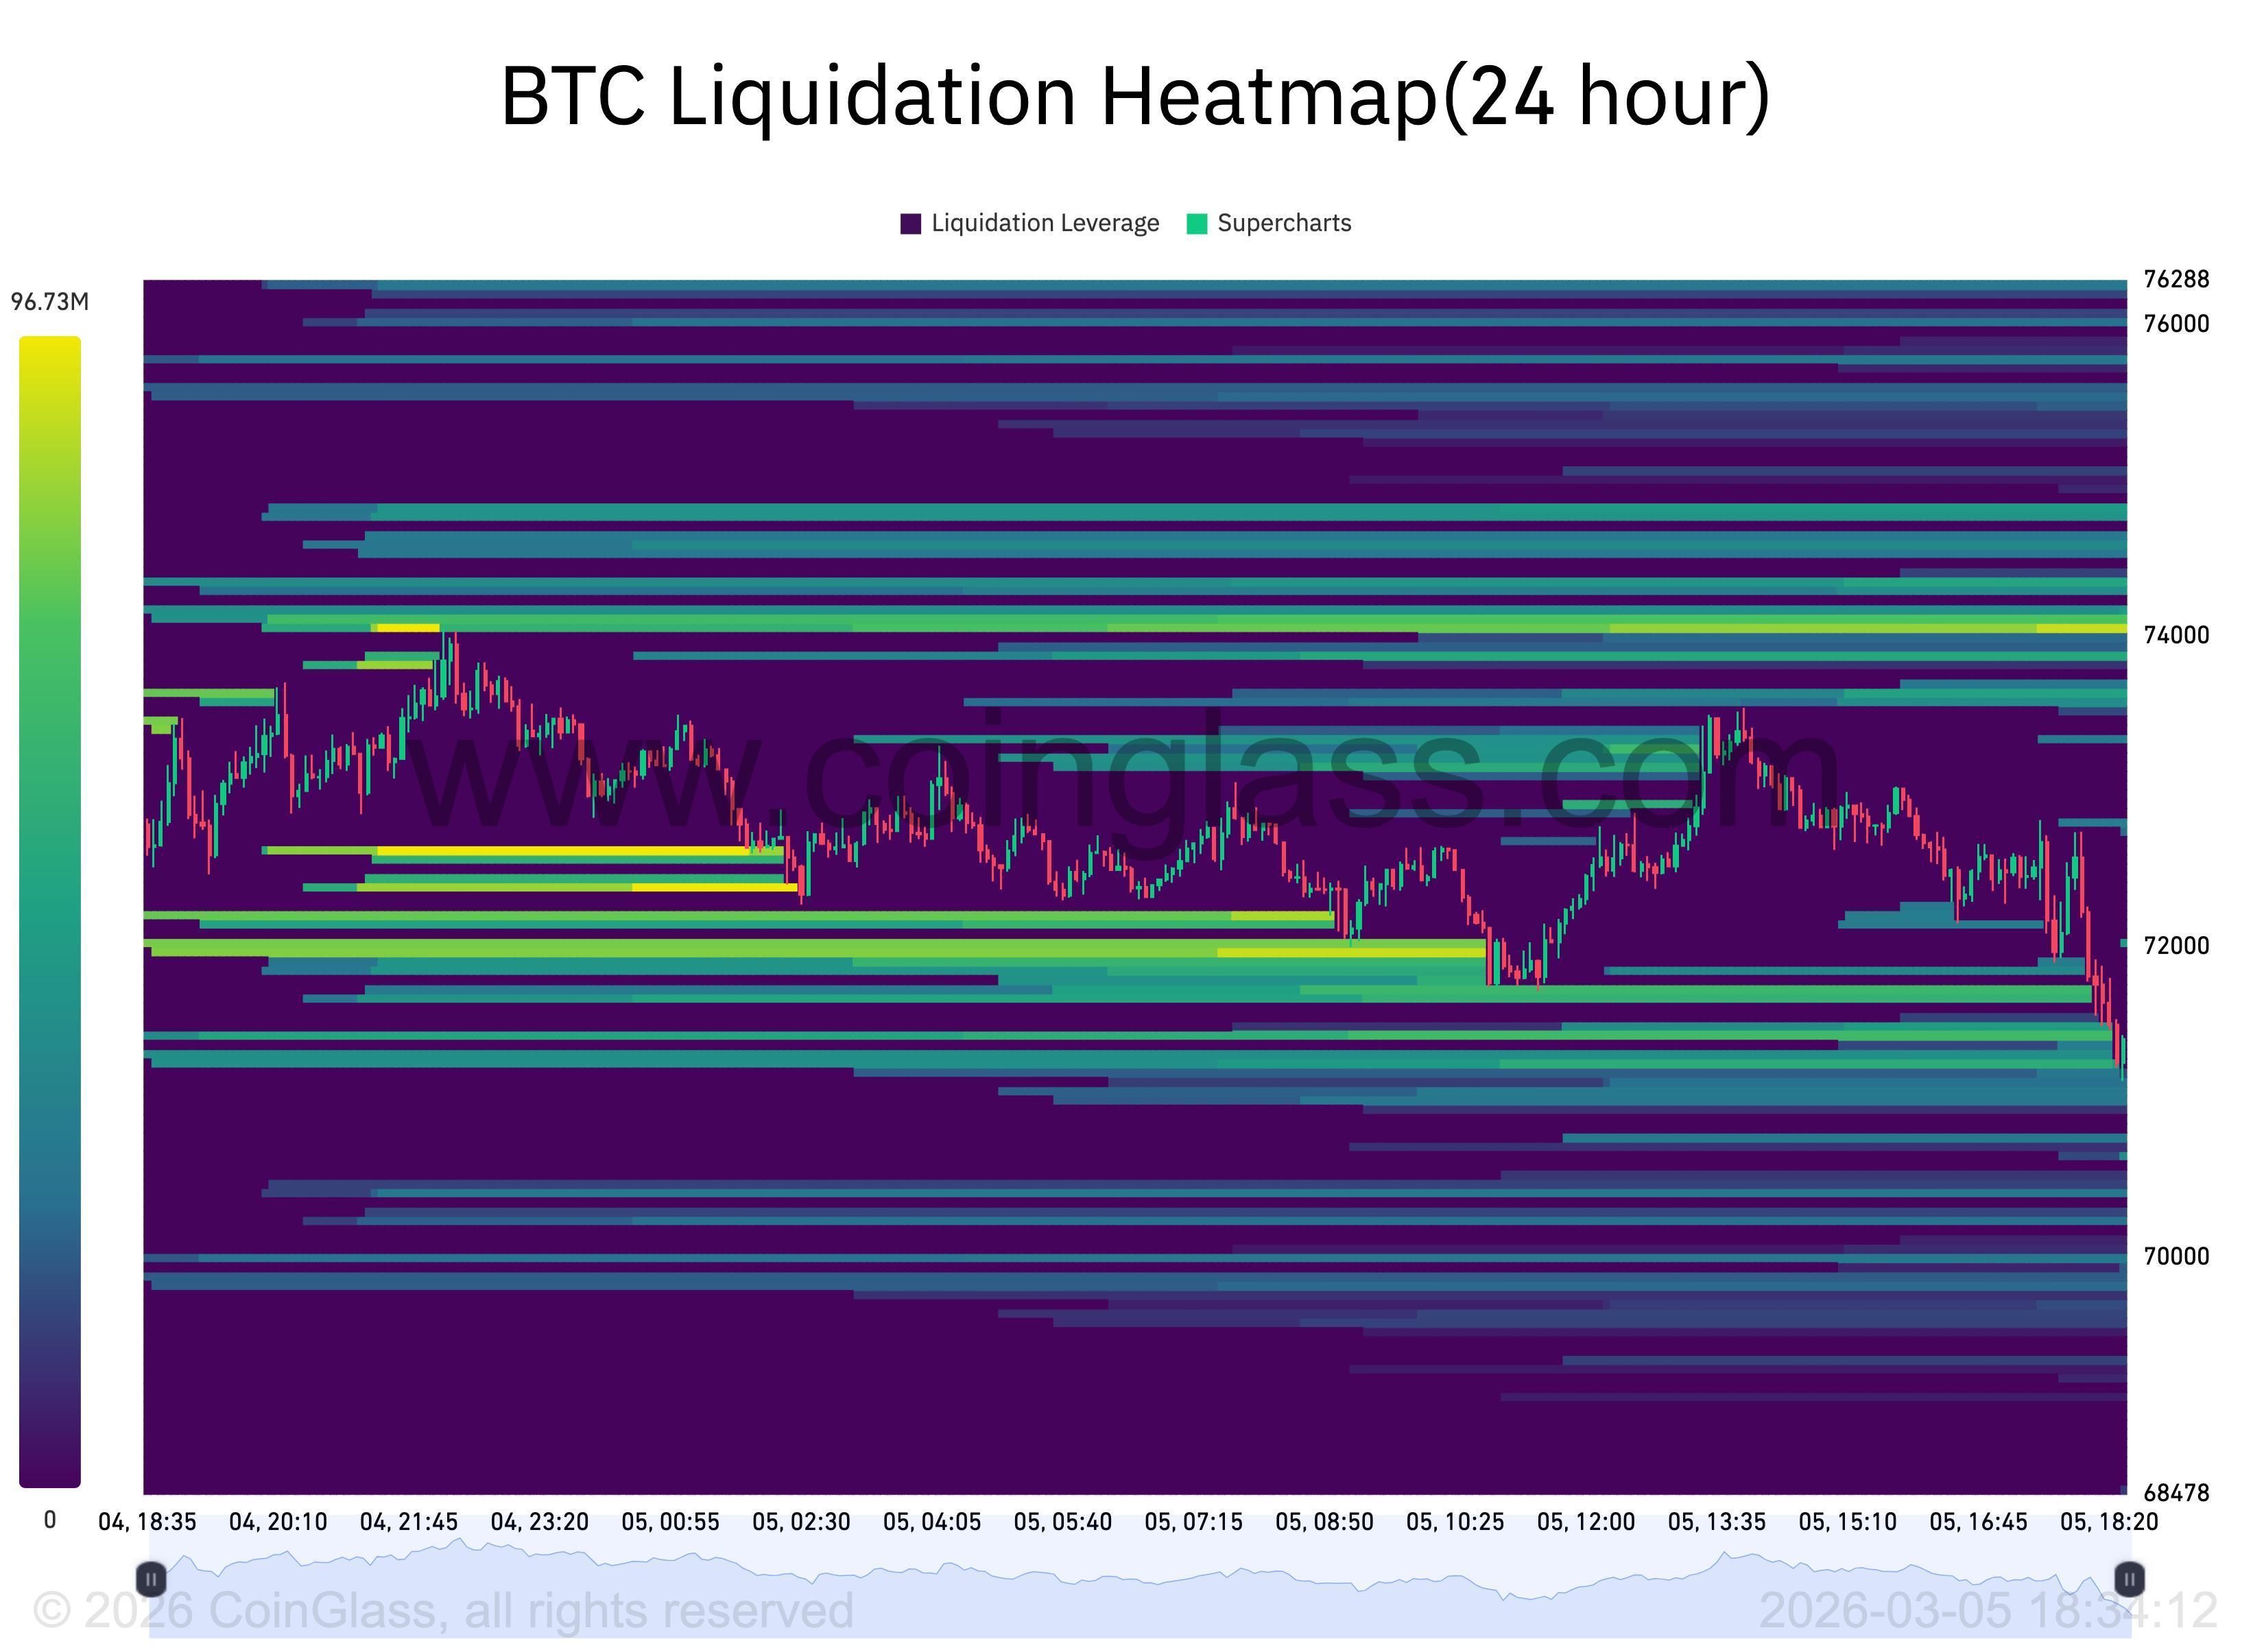 BTC liquidation heatmap. Source: CoinGlass
BTC price meets next “moment of truth”
Continuing, trader Jelle described the current price setup as a “moment of truth.”
Related: Bitcoin bears 'annihilated' as analysis sees $65K support test next
“Deviation or successful breakout? We'll know soon enough,” he told X followers on the day.
An accompanying chart compared recent days to a longer consolidation pattern seen at the end of 2025 — one that ultimately resolved to the downside.
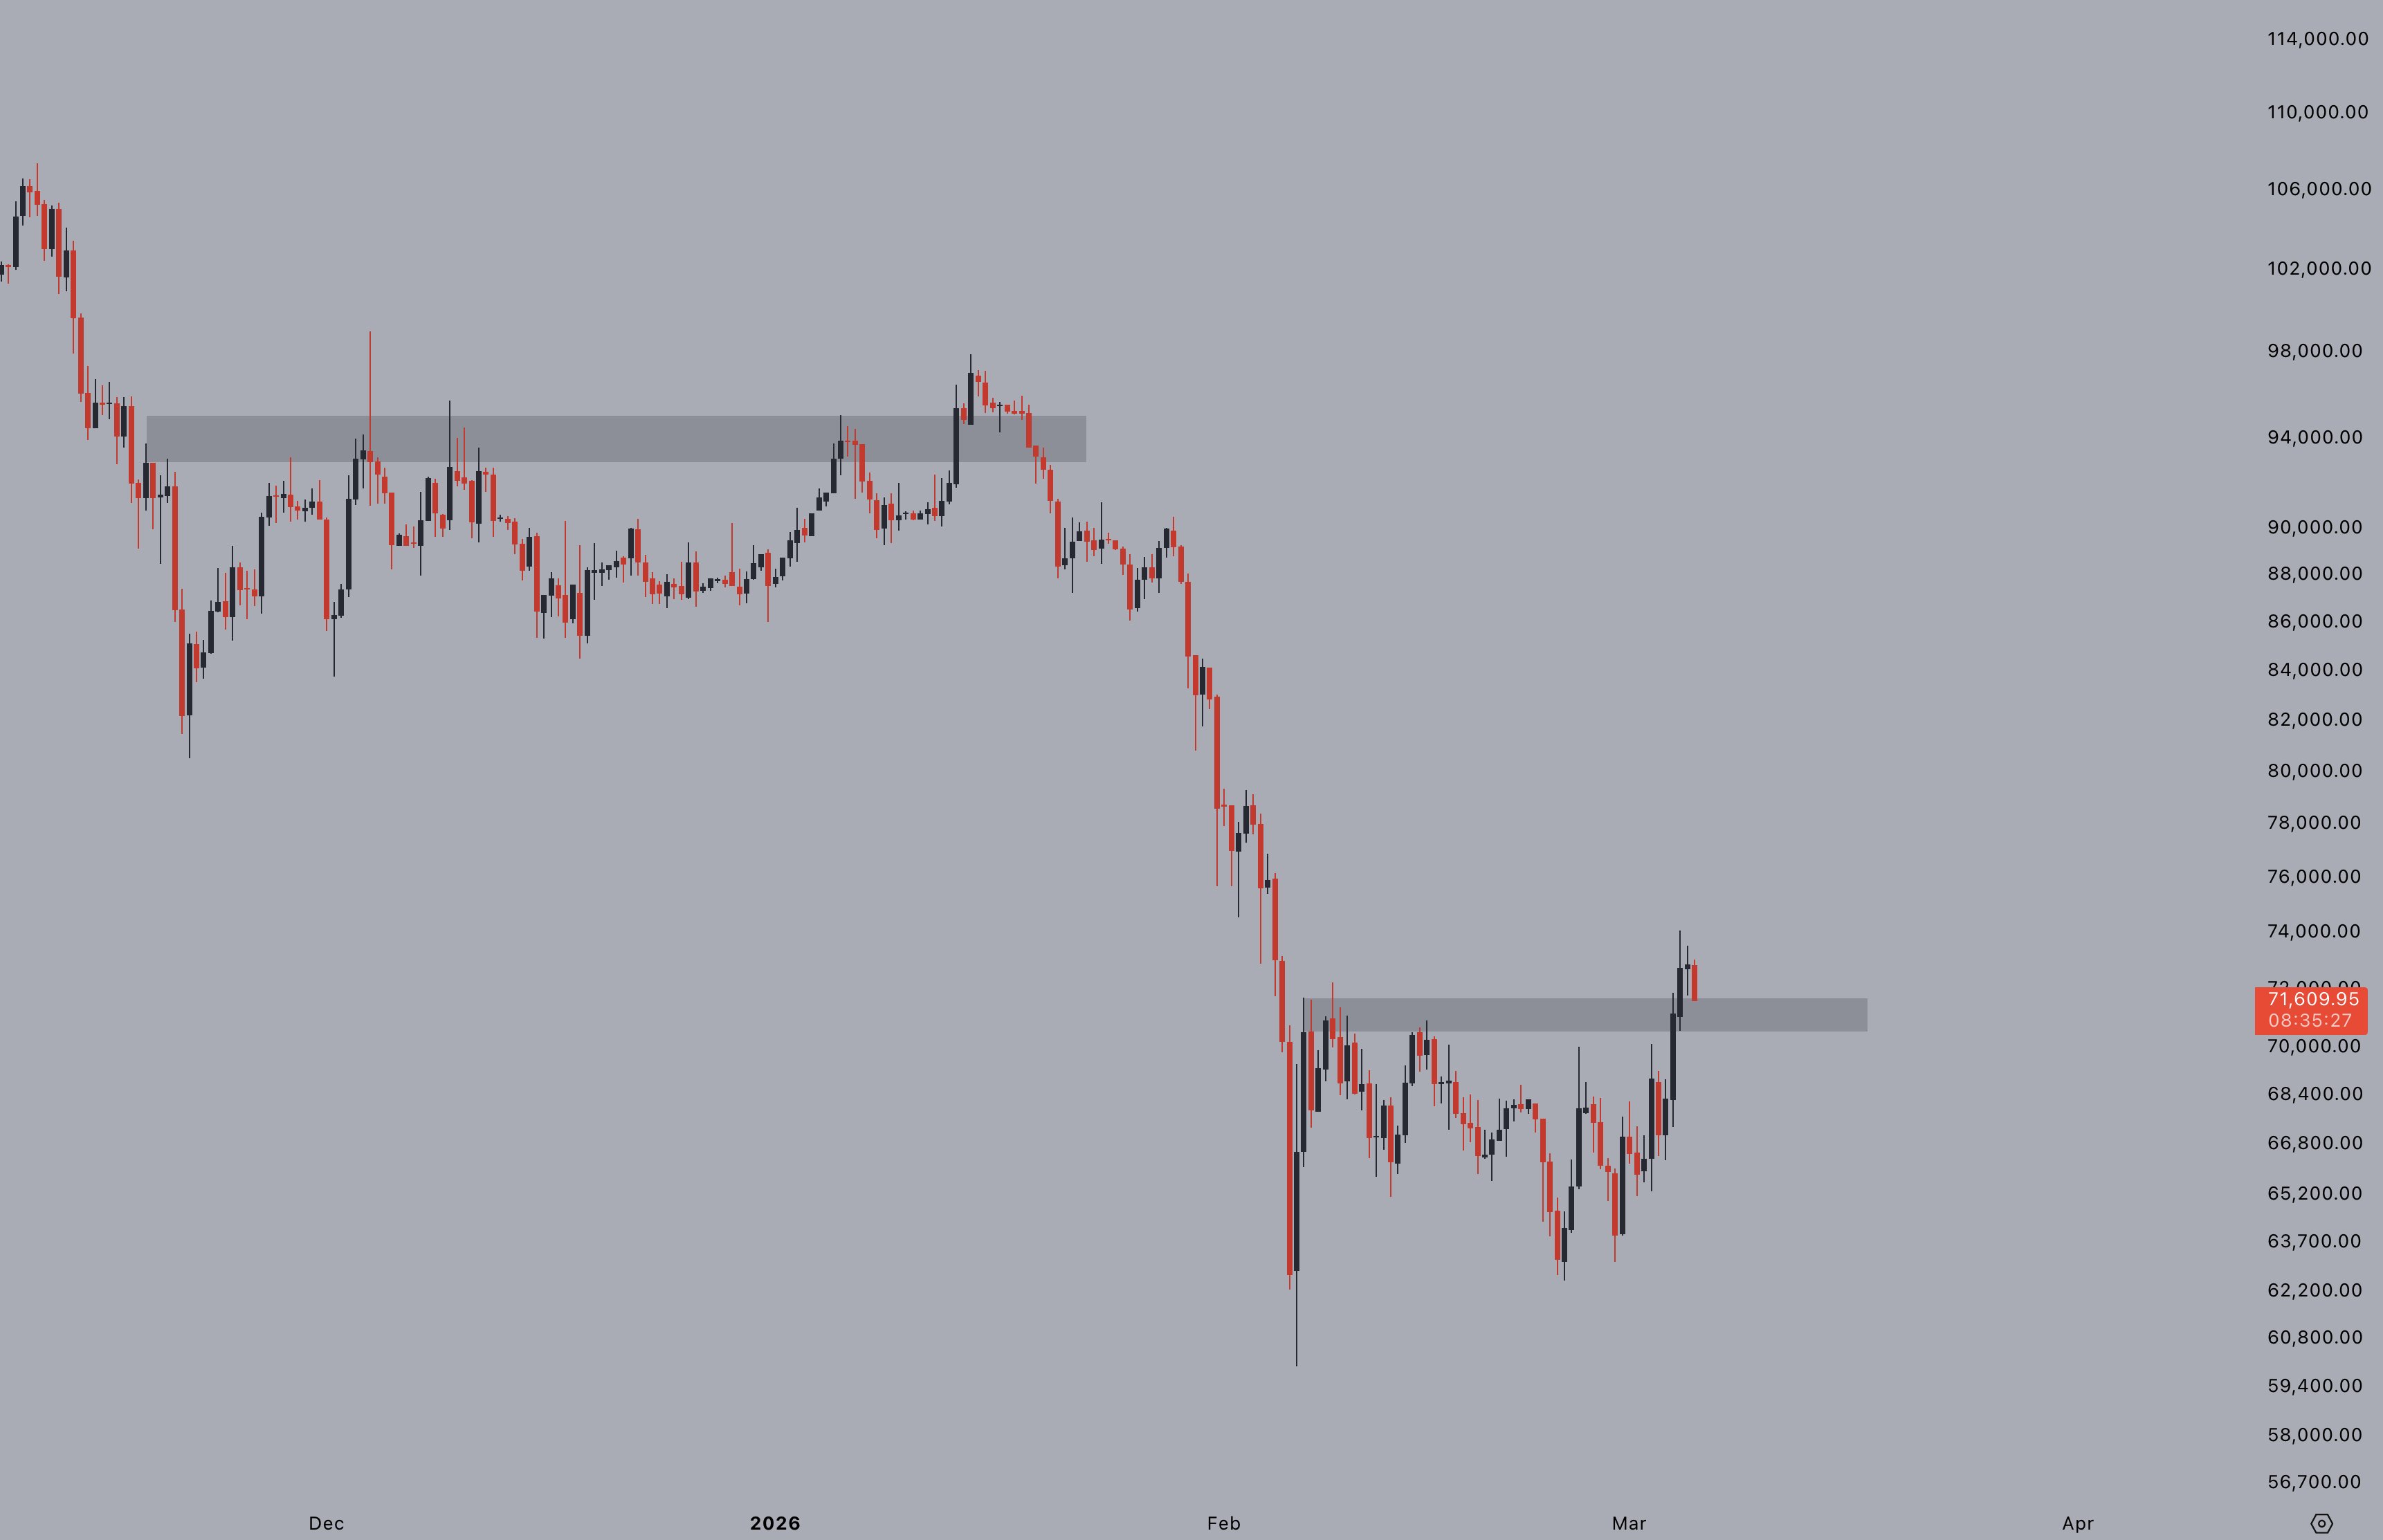 BTC/USD chart. Source: Jelle/X
Earlier, Cointelegraph reported on expectations of new lows to come next for BTC/USD, thanks to a “death cross” about to confirm on the weekly chart.
Doubling down on his existing bearish stance, trader Roman thus felt confident about the latest rally failing to spark a broader recovery.
“One more high should give us divergences + volume has been very lackluster on the 1D,” he wrote on X.
“Amongst all things, this is just a bearish breakdown & retest of prior support turned into resistance. Lower soon.”
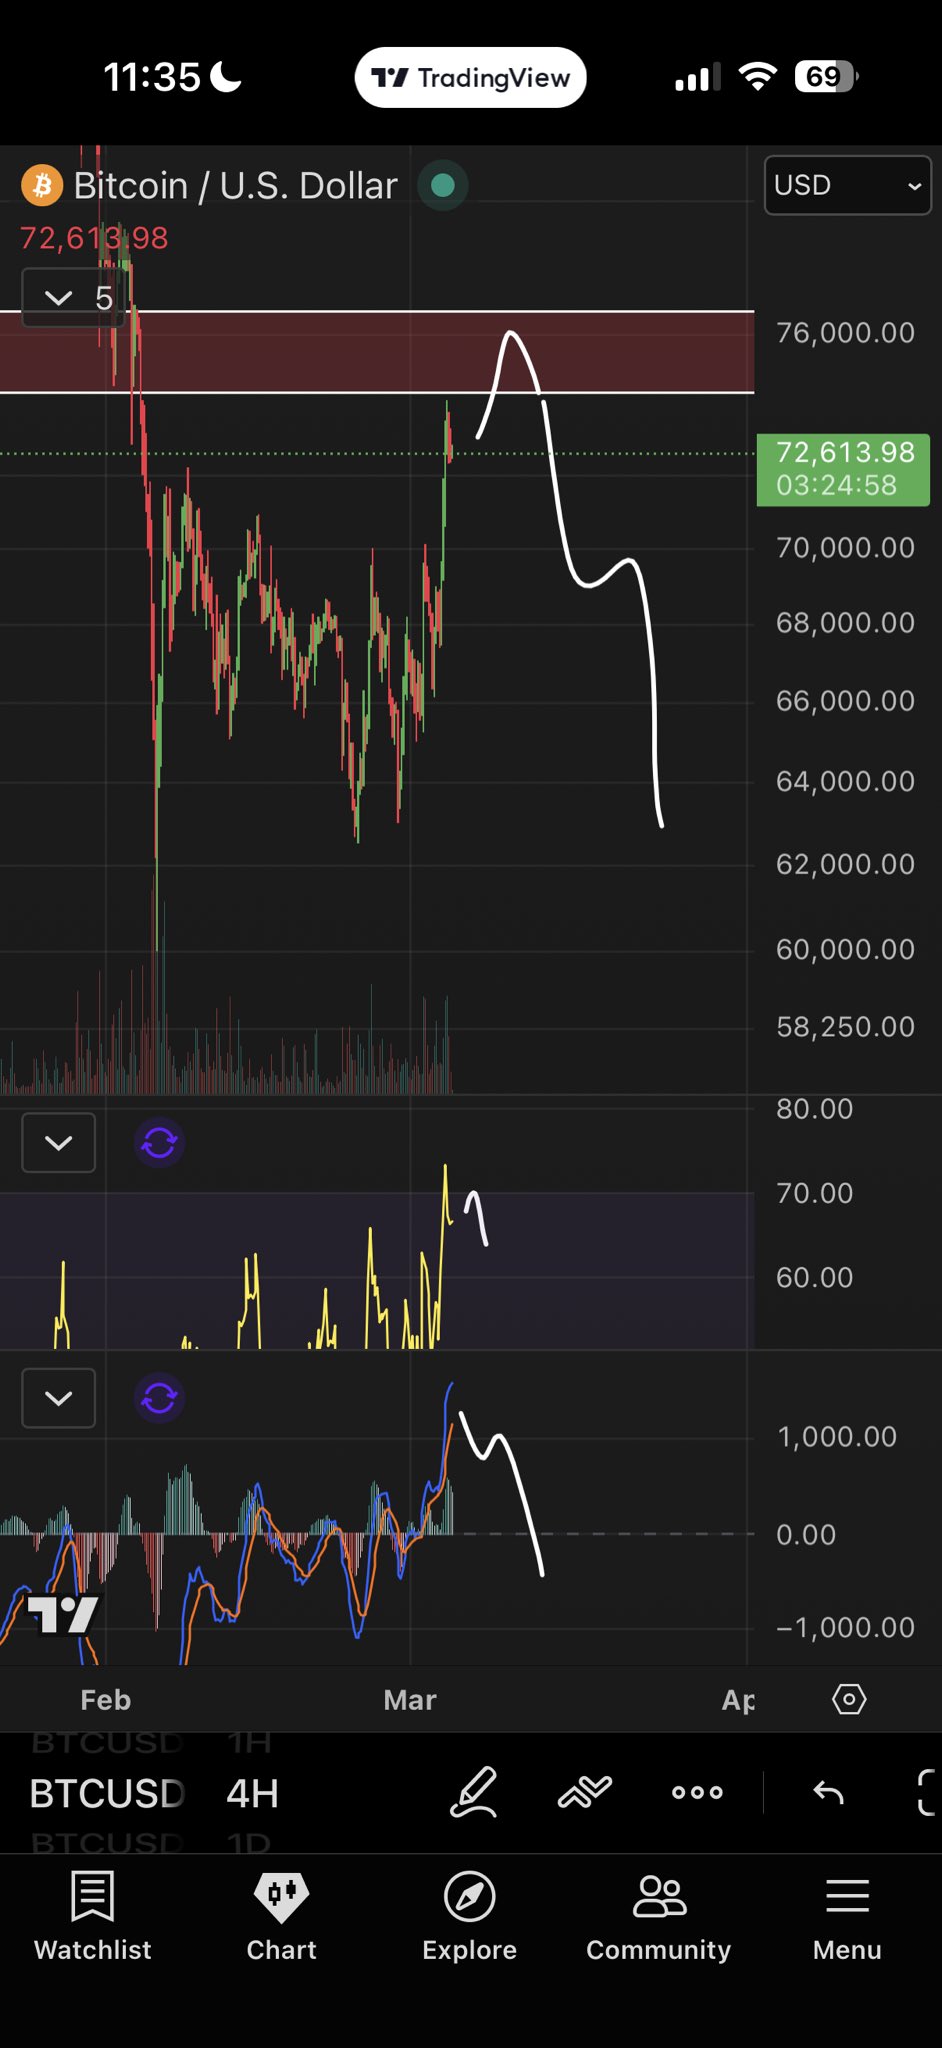 BTC/USD four-hour chart. Source: Roman/X
Disclaimer: The content of this article solely reflects the author's opinion and does not represent the platform in any capacity. This article is not intended to serve as a reference for making investment decisions.
You may also like
Meta (META.US) surged 36% in September: Muse validates AI strategy, market cap targets $2 trillion
Meta's stock is on track to achieve its best monthly performance since July 2013, and is only about a 1% increase away from joining the $2 trillion market cap club.
Consumption stratification intensifies, Costco remains "firmly seated in Diaoyutai"?
Is the market less confident in US Treasury bonds than before?
Up 36% in September! Meta achieves its best monthly performance since 2013, with market value approaching $2 trillion
Since September, Meta's stock price has rebounded significantly. The rapid rise of Muse has reignited market expectations for its AI commercialization. Muse reached 902,000 downloads within six days of launch and is quickly expanding into shopping, travel, and other scenarios. The market is beginning to bet that AI agents could unlock new growth opportunities beyond advertising. However, security and privacy risks, as well as high computing power costs, remain key factors in realizing these expectations.
Crypto prices
More


