

-
Dogecoin is approaching major structural levels, and the next decisive breakout or breakdown will likely define its near-term momentum and volatility expansion.
-
Market sentiment and compression near key support zones suggest a high-probability setup where the next price action appears uncertain
Dogecoin price is down by 6.24% to $0.09115 in the past 24 hours, primarily driven by the sell-offs. The memecoin space is facing renewed selling pressure as the other tokens have also experienced significant losses. With this, the token has reached a crucial turning point, and this time these signals are coming from both DOGE/BTC & DOGE/USDT pairs. Historically, moments like this have preceded strong volatility expansions, either explosive upside or extended underperformance.
Now the question arises: What’s next for the Dogecoin price rally?
DOGE/BTC at a Trigger Point
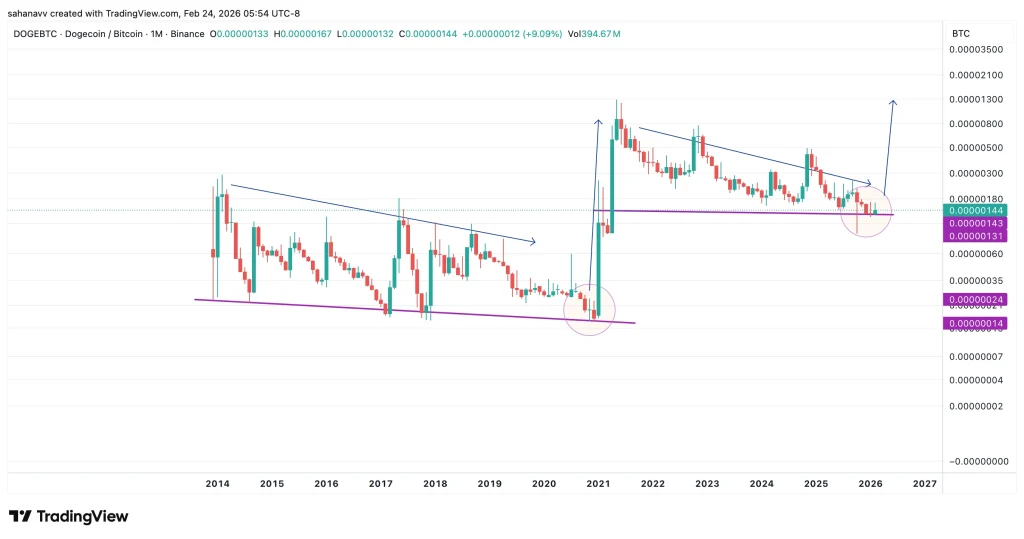
The DOGE/BTC monthly chart reveals a long-term compression pattern that has been building for years. After its explosive 2021 rally, often referred to as “Doge season”, the pair entered a prolonged downtrend marked by consistent lower highs. Since then, volatility has steadily contracted, forming a multi-year compression structure. This type of structure matters because DOGE/BTC measures relative strength. When DOGE/BTC rises, Dogecoin is outperforming Bitcoin, and when it falls, capital prefers BTC.
What the Structure Shows
- A clear sequence of lower highs since the 2021 peak
- Multi-year consolidation near structural support
- Volatility compression similar to pre-2021 expansion
The chart now shows the price sitting near a historical base—a level that previously acted as a launchpad before major upside. This is what traders often call a “trigger zone.” If DOGE/BTC breaks above its compression boundary and begins forming higher highs, it would signal a relative strength shift. That could indicate capital rotation from Bitcoin into Dogecoin, historically the early stage of meme-driven expansion cycles.
If support fails, DOGE could continue to underperform Bitcoin, meaning even if BTC rises, DOGE may lag.
DOGE/USDT Testing Historical Support
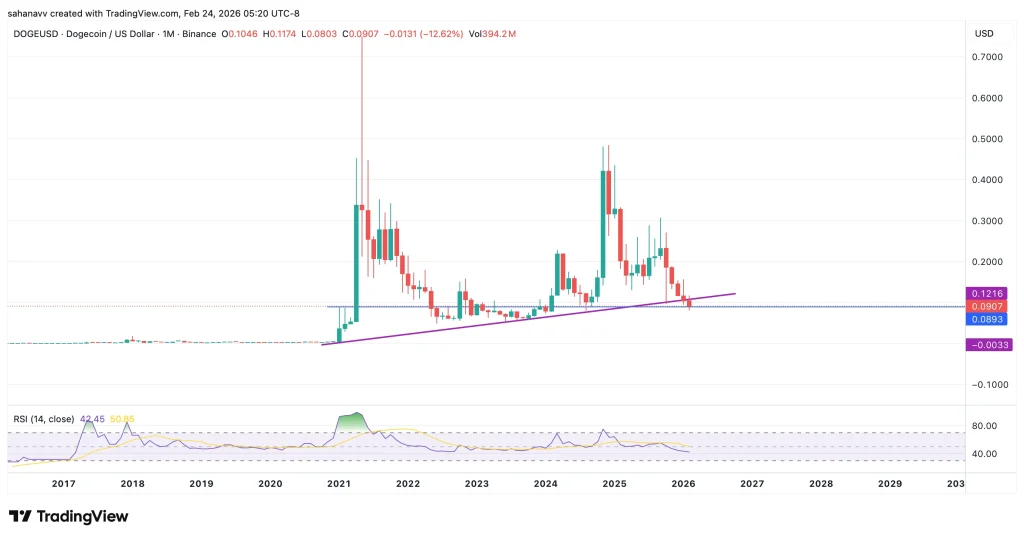
While DOGE/BTC tells us about performance versus Bitcoin, DOGE/USDT shows us absolute value. On the monthly timeframe, Dogecoin is currently testing a long-term ascending trendline that dates back to previous cycle lows. Price is hovering near the $0.08–$0.09 region — a zone that historically acted as a strong demand area.
Key Observations
- Long-term ascending support is being retested
- Price sits near prior accumulation zones
- RSI remains neutral to slightly weak, not deeply oversold
This isn’t a euphoric setup. It’s a compression setup. Repeated tests of support increase pressure. Eventually, either buyers defend it decisively, or it breaks. If support holds, a strong bounce from this zone could open the door toward the $0.12 resistance area first. A sustained move above that level would strengthen the bullish case.
If support breaks, a clean breakdown below the trendline could expose DOGE to deeper downside toward the next historical demand pocket.
Conclusion: A Defined Trigger, A Pending Expansion
Dogecoin price is sitting at a clear inflection point across both pairs. On DOGE/BTC, price remains compressed near long-term support. A confirmed breakout above the compression boundary would signal relative strength expansion and potential capital rotation into DOGE. Failure to hold support keeps the broader downtrend intact.
On DOGE/USDT, the $0.08–$0.09 region remains critical. As long as this historical support holds, a rebound toward $0.12 is technically viable. A decisive breakdown below the trendline would invalidate the bullish case and open room for deeper downside.


