
Bitcoin must close week at $68.3K to avoid 'bearish acceleration:' Analyst

Bitcoin (BTC) battled a key 200-week trend line around Thursday’s Wall Street open as “bearish acceleration” fears persisted.
Key points:
Bitcoin threatens to add the 200-week exponential moving average to its list of new resistance levels.
History offers lessons for what happens when price rejects from the key 200-week trend line.
Mayer Multiple values continue to show BTC in deep “oversold” territory.
Bitcoin’s fate hangs on $68,300 reclaim
Data from showed BTC price action focusing on the area around $67,000 for a second day.
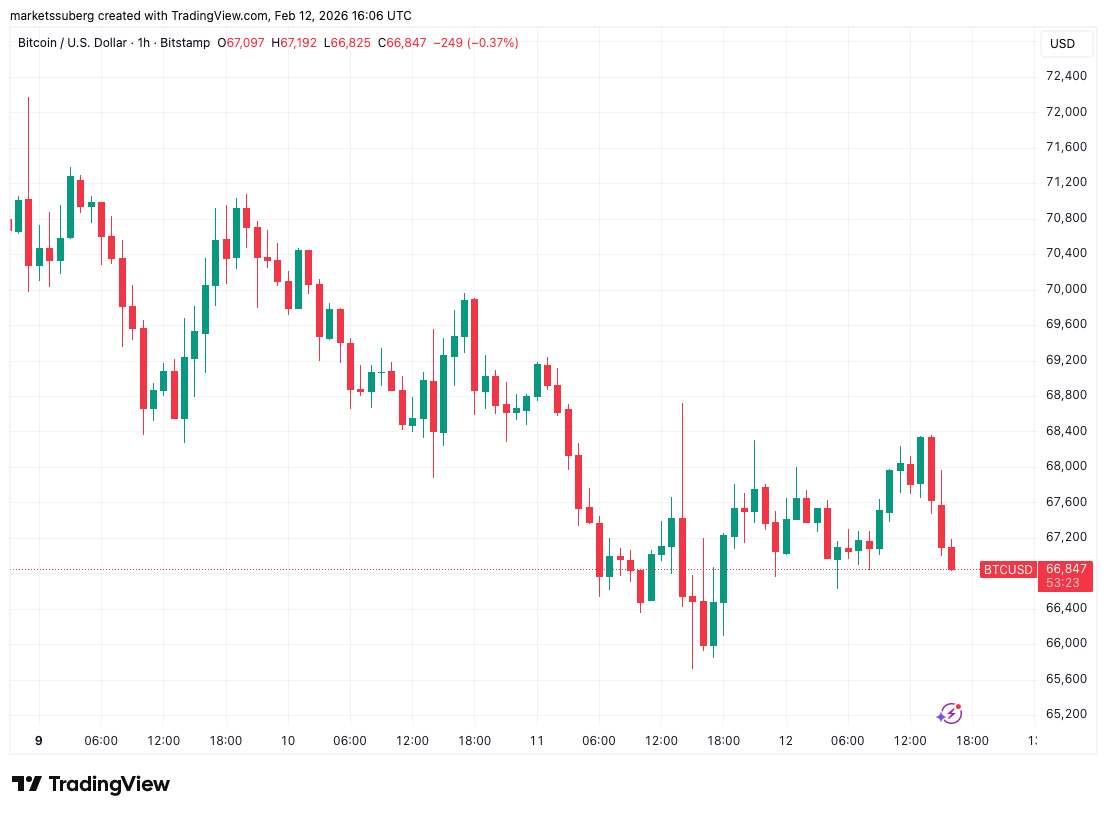 BTC/USD one-hour chart. Source: Cointelegraph/TradingView
Bulls already faced a — something stopping them from reclaiming the old 2021 all-time high at $69,000.
Now, Bitcoin’s 200-week exponential moving average (EMA) came into focus as a potential second new resistance level.
Commenting on the phenomenon, trader and analyst Rekt Capital employed comparisons to previous Bitcoin bear markets to warn that a failure to rescue the 200-week EMA would result in worse price downside.
“What would confirm additional downside for Bitcoin? Historically, a Weekly Close below the 200-week EMA (black) followed by a post-breakdown retest of the EMA into new resistance (red circles) has triggered additional Bearish Acceleration,” he wrote alongside a chart on X.
“The 200-week EMA (black) represents the price point of ~$68300. Therefore a Weekly Close below ~$68300 followed by a bearish retest of it would likely position Bitcoin for a repeat of history with additional downside over time.”
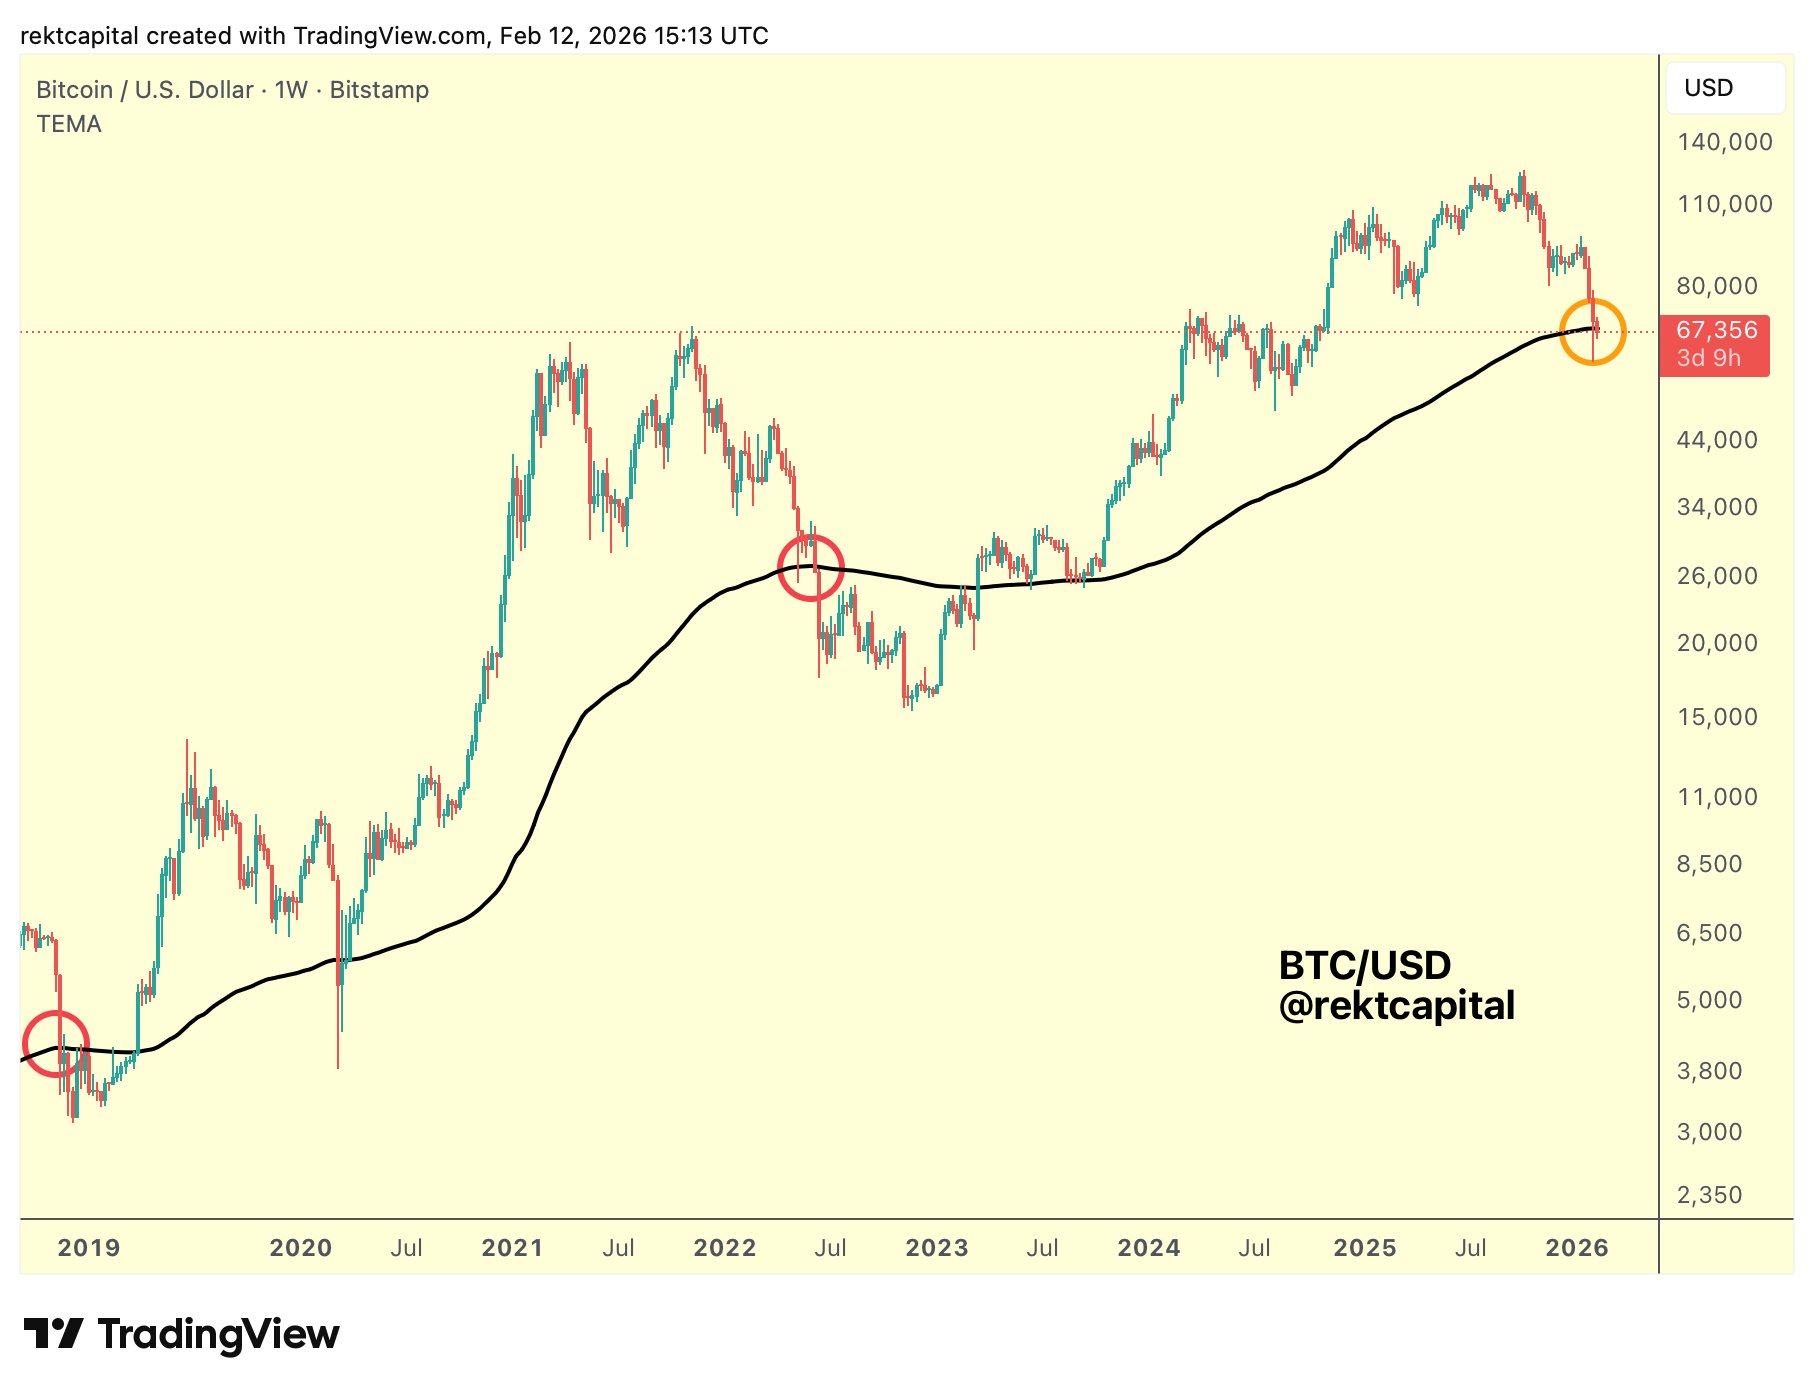 BTC/USD one-week chart with 200EMA. Source: Rekt Capital/X
Analysis had hoped that the EMA would act as a prior to last week’s break below $60,000. Together with the 200-week simple moving average (SMA), it now forms a “cloud” of support that price has so far avoided violating.
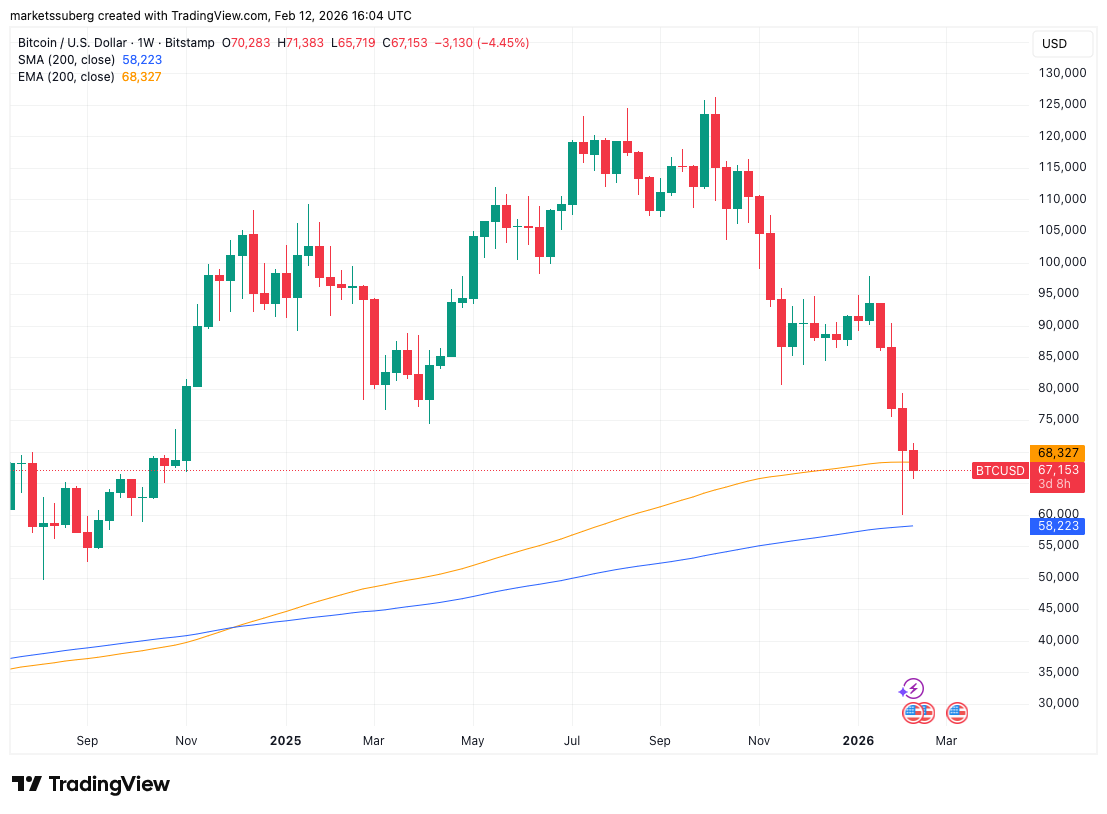 BTC/USD one-week chart with 200SMA, 200EMA. Source: Cointelegraph/TradingView
Adopting a more hopeful tone, William Clemente, head of strategy at crypto over-the-counter settlement platform Styx, eyed a buying opportunity.
“Throughout Bitcoin's life span we have seen two indicators continue to be the best global market bottom signals: The Mayer multiple (distance from 200 day moving average) and the 200 week moving average,” he argued on the day.
“Both of these are clearly in long term accumulation territory.”
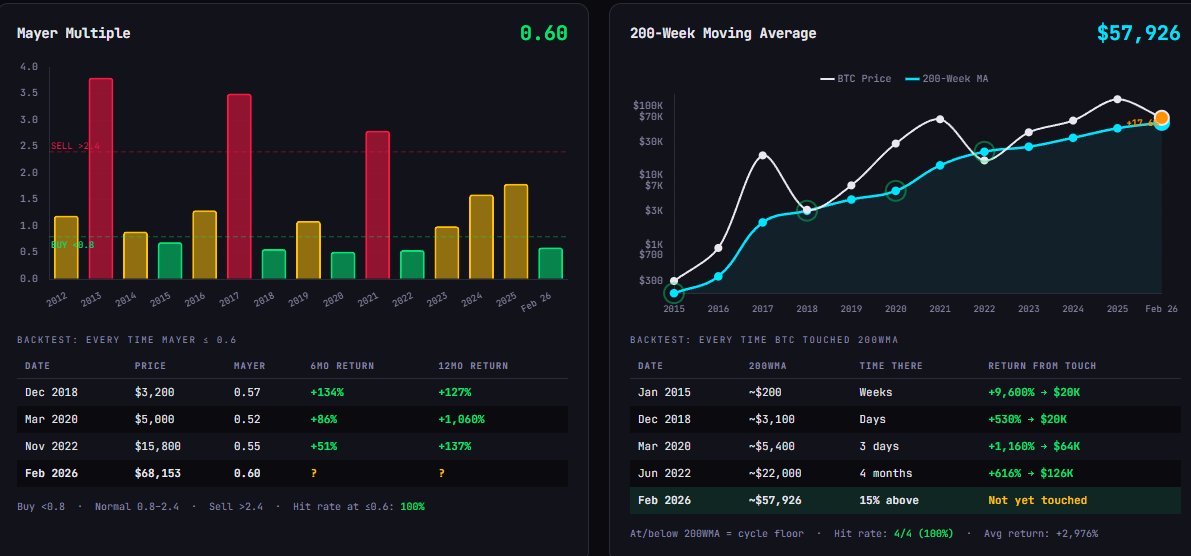 Bitcoin Mayer Multiple, 200-week SMA data. Source: William Clemente/X
Classic BTC price metric screams “cheap”
Continuing on the topic, the X analytics account named after famous economist Frank Fetter stressed just how rare current Mayer Multiple readings were.
Related: BTC traders wait for $50K bottom: Five things to know in Bitcoin this week
The Multiple is one of the best-known Bitcoin price yardsticks, and readings below 0.8 traditionally signify good long-term odds of returns. At the other end of the scale, a reading above 2.4 implies that caution is warranted.
“Only 5.3% of days have seen the Bitcoin Mayer Multiple at a lower level. Yeah it can go lower but I’m running out of ways to say BTC is cheap here,” the account told followers.
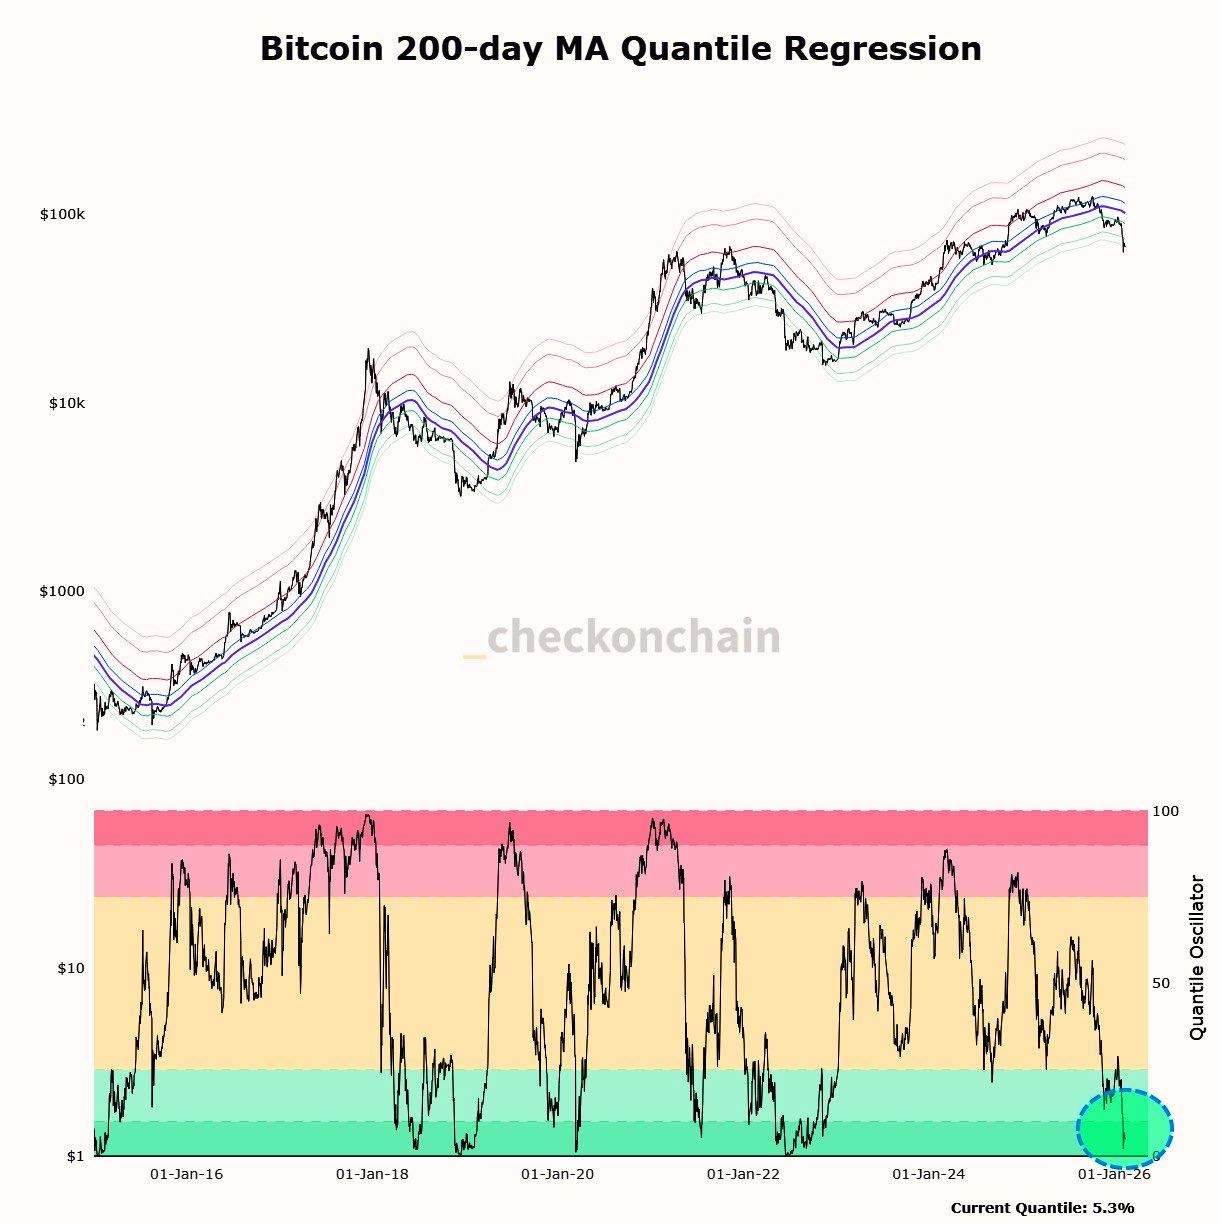 Bitcoin 200-day SMA quantile regression. Source: Frank A. Fetter/X
As Cointelegraph reported, Bitcoin last saw such low Mayer Multiple levels during the 2022 bear market.
Last week, Charles Edwards, founder of quantitative Bitcoin and digital asset fund Capriole Investments, agreed.
“It rarely hits 0.6x. Can price go lower?” he queried.
“Yes, but this is historically one of the best buy signals in Bitcoin history.”
Disclaimer: The content of this article solely reflects the author's opinion and does not represent the platform in any capacity. This article is not intended to serve as a reference for making investment decisions.
You may also like
AI demand drives TSMC to accelerate capacity expansion, 2nm monthly production aims for 120,000 wafers by year-end
According to reports, industry giants such as Apple, Nvidia, and AMD have collectively increased their orders by 10% to 20%, directly boosting TSMC's 2nm monthly production capacity to 120,000 wafers by the end of the year, which exceeds the previous estimate by more than 20% and brings forward the 2027 target by two years. For the first time in history, five factories will ramp up production simultaneously, and the annual compound growth rate of capacity from 2026 to 2028 will reach as high as 70%.
Long-term US Treasury Sell-off Continues! 10-Year Treasury Yield Breaks 5.2% Again, “AI Boom vs. Rising Financing Costs” Narrative Showdown Intensifies
On Monday, oil prices rose and US Treasury bonds were sold off again as former US President Donald Trump rejected Iran's latest proposal to reopen the Strait of Hormuz, heightening concerns about inflation.
Banks Have Been Earning Effortlessly from Idle Funds for Years—Will AI Agents Change Everything?
For years, banks have profited from customers' idle funds, but AI agents may be about to change this situation.
Goldman Sachs: US stocks are showing a "strong index, weak confidence" pattern; catch-up rally may become the main theme of the next phase
Goldman Sachs stated that the current U.S. stock market is showing an unusual pattern: while index performance is strong, investor confidence remains weak. This suggests that the market still has further upside potential, and stocks that previously lagged behind leading AI stocks may soon experience a catch-up rally.

Crypto prices
More


