
COAI Price Eyes a New All-Time High Post-Breakout, but One Risk Remains

ChainOpera’s (COAI) price has surged over 50% in a day after breaking out of a symmetrical triangle on the 4-hour chart. On-chain signals show improving buying pressure, but weakening momentum hints that the rally might pause before extending. A clean move above $31 could send COAI to a new all-time high, yet one key risk remains that could trigger a short-term pullback first.
ChainOpera’s (COAI) price has surged more than 50% in the past 24 hours after a breakout on the 4-hour chart. The newly listed AI-focused token, part of Binance’s Alpha Spotlight program, has drawn quick attention from traders.
The pattern suggests more upside could follow, but one technical signal still hints that a short-term pullback may interrupt the rally.
Money Flow Leans Positive, but Momentum Might Stall
COAI broke out of a symmetrical triangle, a pattern that forms when price makes lower highs and higher lows, showing consolidation before a large move. A confirmed close above this structure usually signals trend continuation, which is now visible on COAI’s 4-hour chart.
Want more token insights like this? Sign up for Editor Harsh Notariya’s Daily Crypto Newsletter .
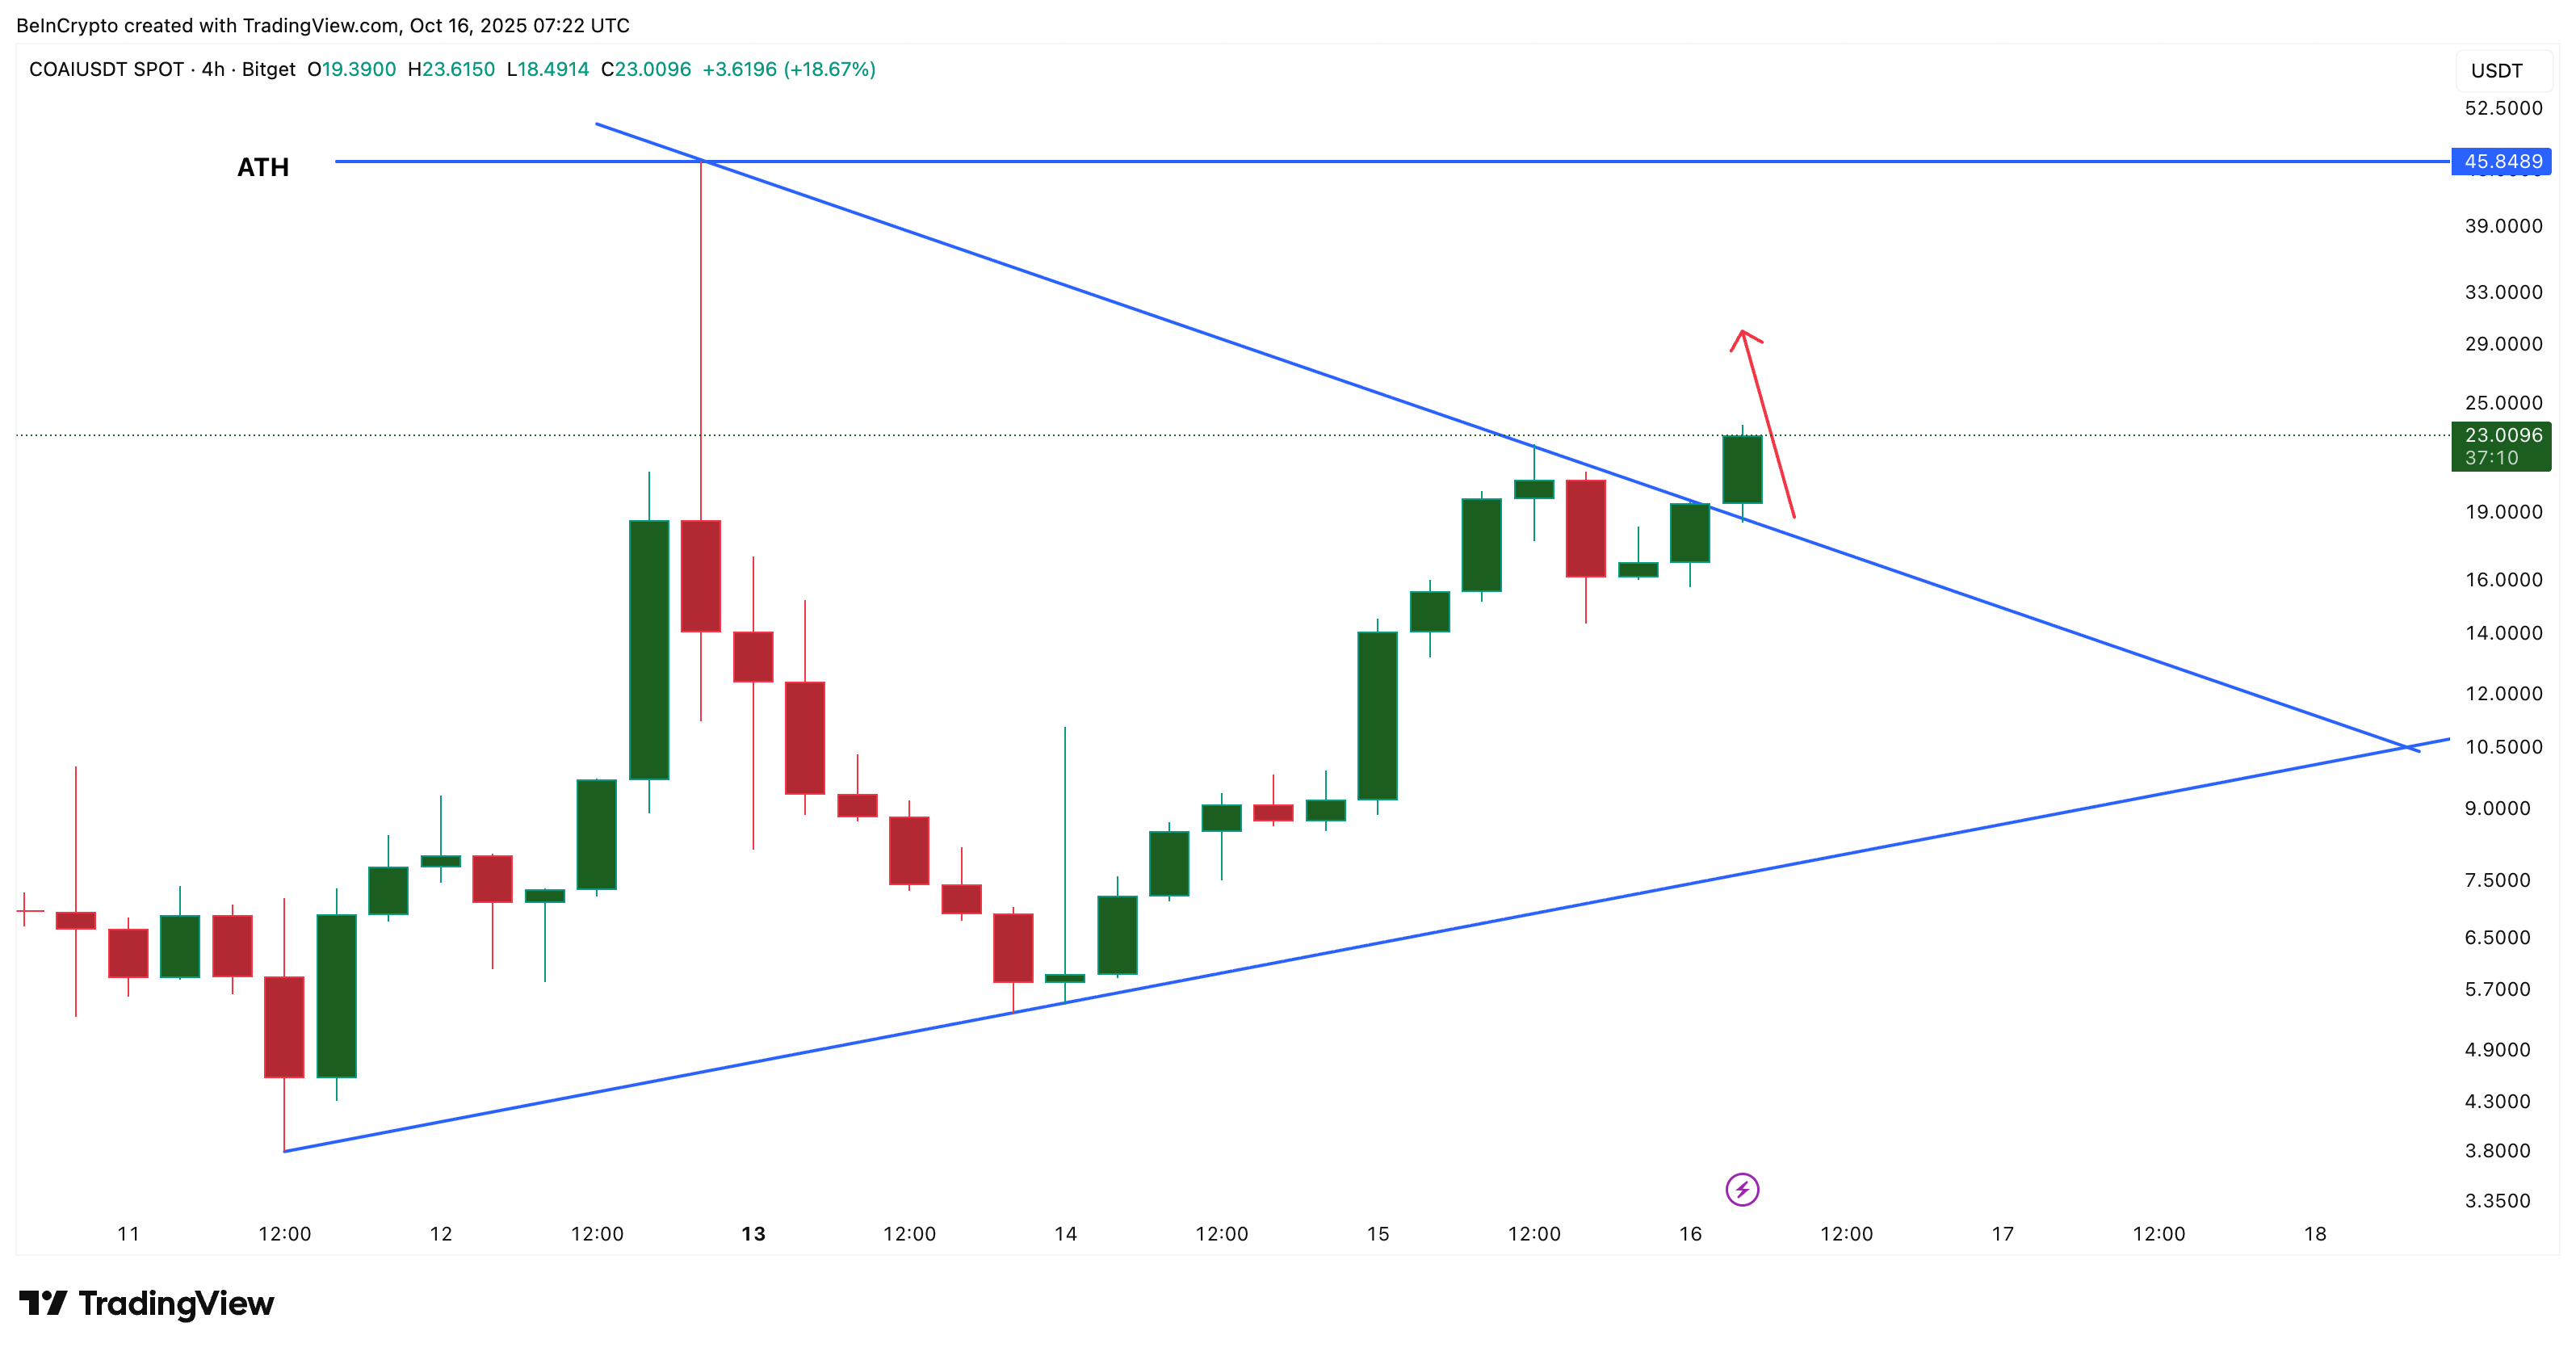 Bullish COAI Pattern:
TradingView
Bullish COAI Pattern:
TradingView
Supporting this breakout, the Chaikin Money Flow (CMF) — an indicator that tracks the flow of money from large investors — has started to turn upward after dipping below zero. This shows that large wallets are returning slowly, though conviction is still limited.
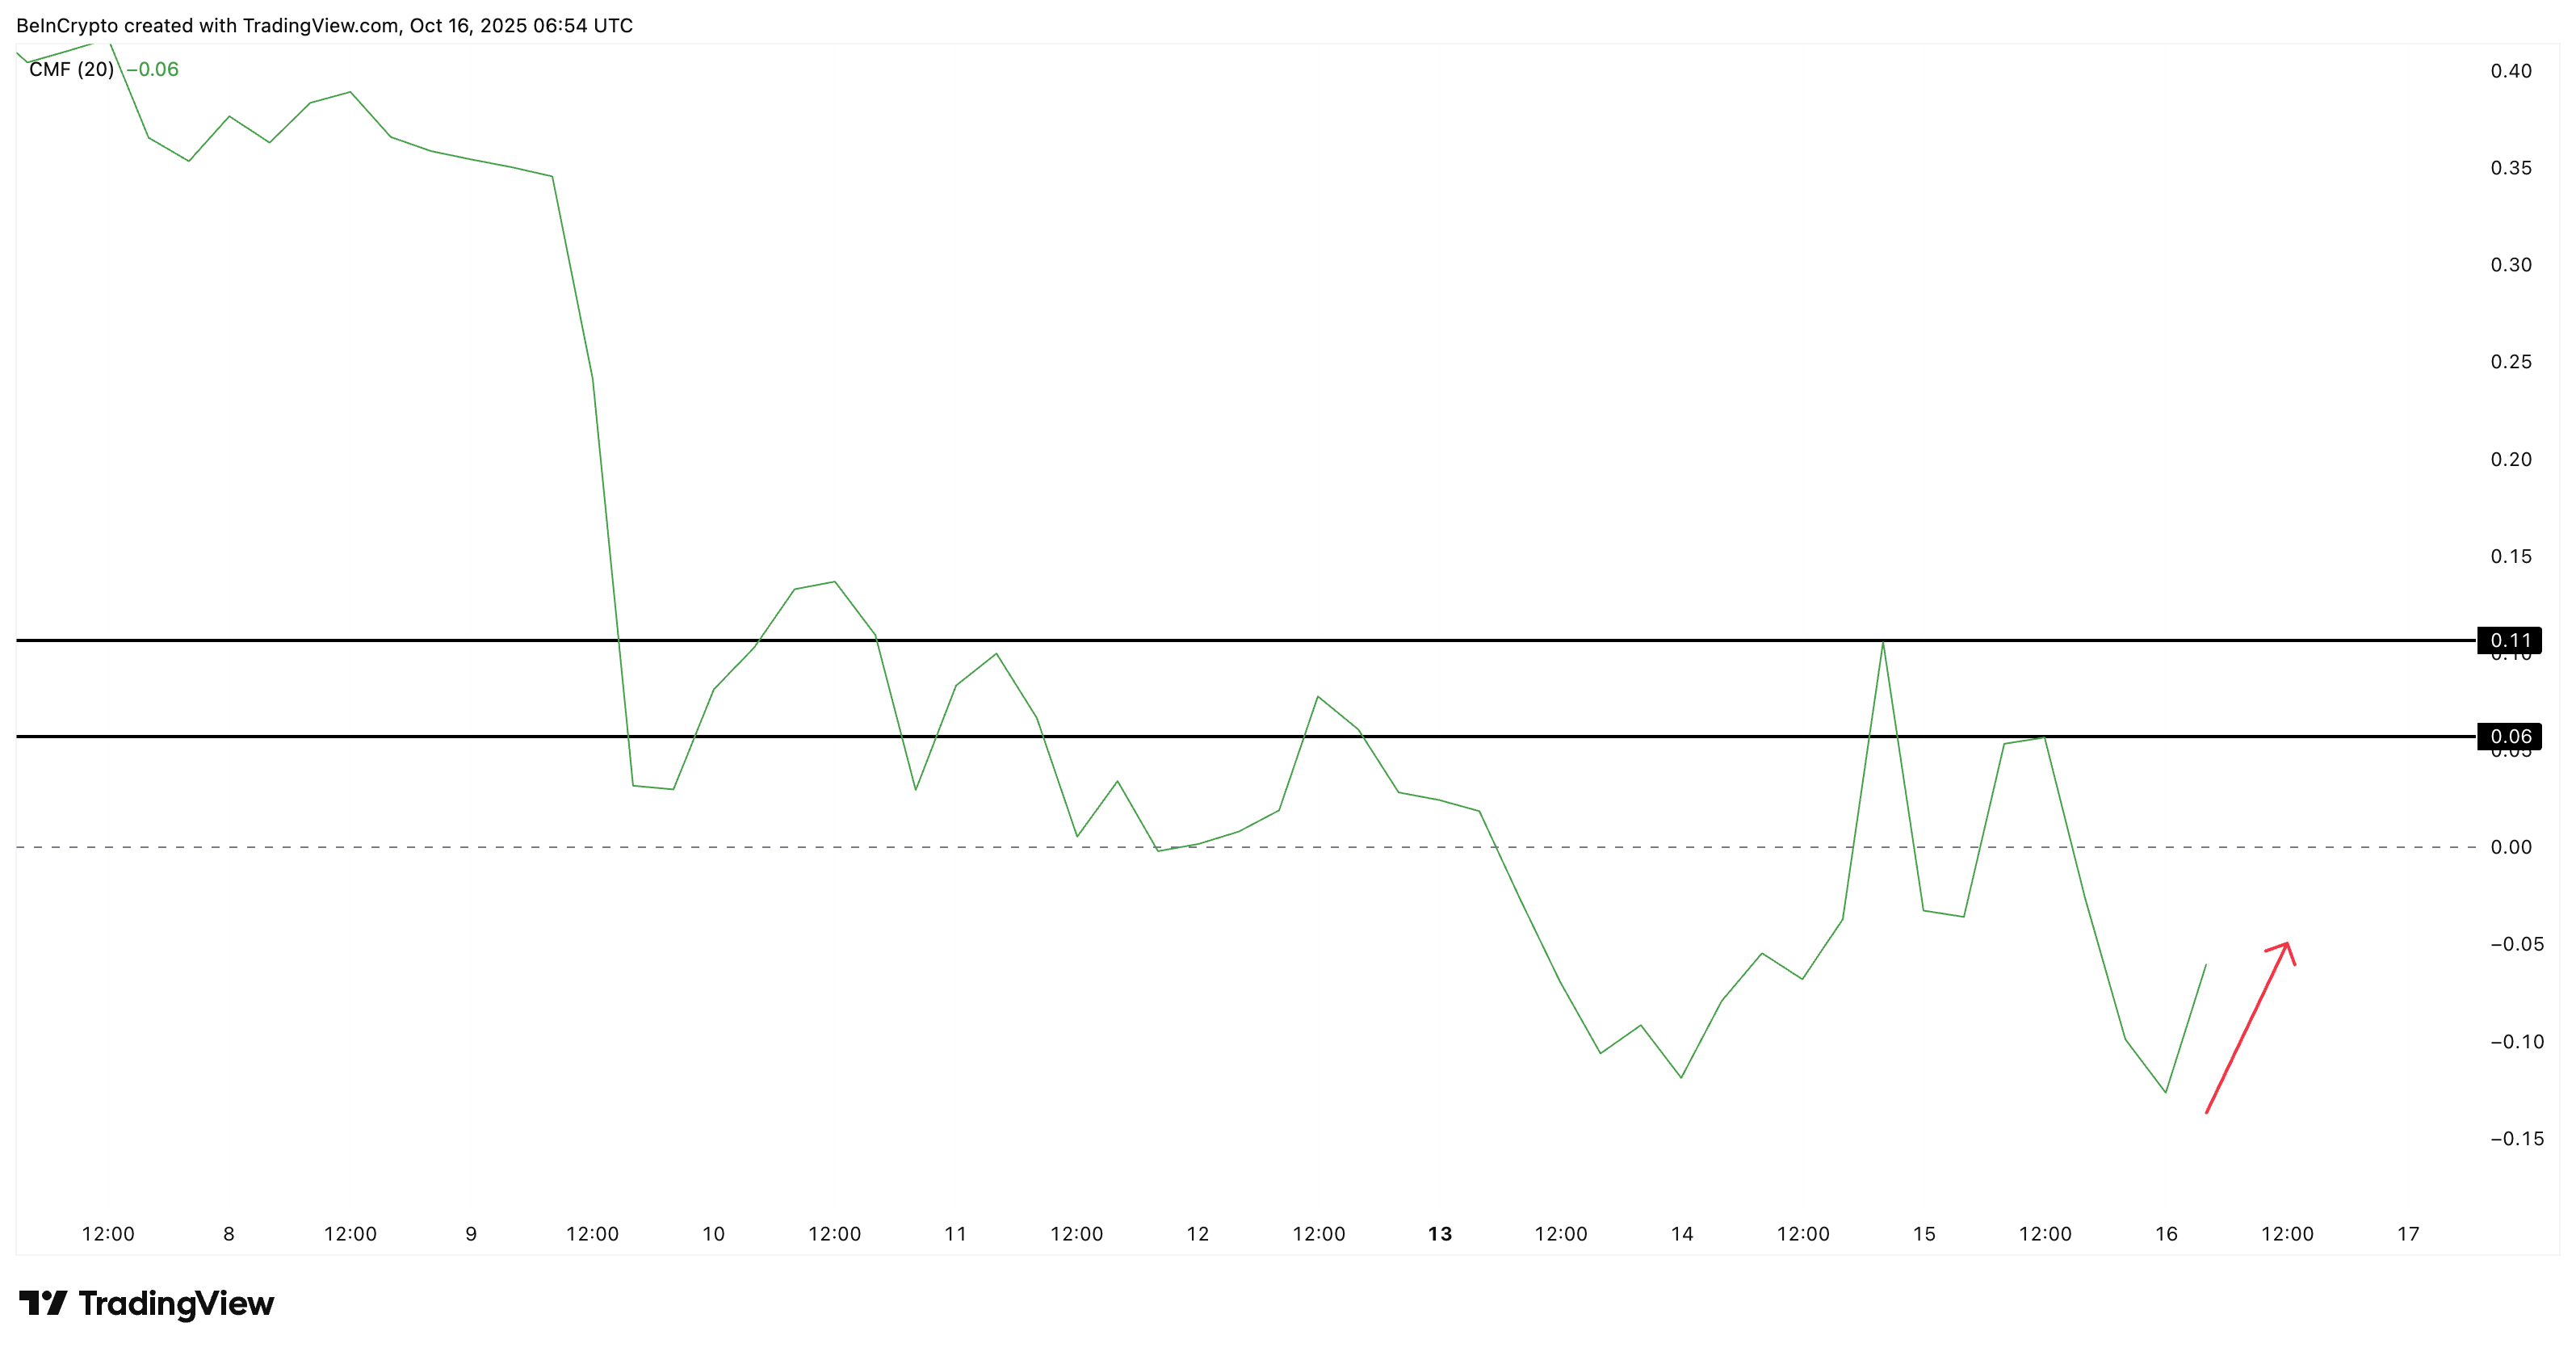 Large Wallets Have Restarted COAI Accumulation:
TradingView
Large Wallets Have Restarted COAI Accumulation:
TradingView
If CMF crosses above 0.06, it would confirm renewed accumulation, while a move toward 0.11 would mark strong inflows and higher whale confidence.
The Money Flow Index (MFI), which measures buying pressure using both price and volume, has climbed steadily since October 14. It indicates active retail participation, but the pattern shows they’re mostly buying strength instead of dips. Every time the COAI price has dipped, MFI has also dipped, indicating a lack of dip-buying money. This pattern might signal a slightly weaker conviction.
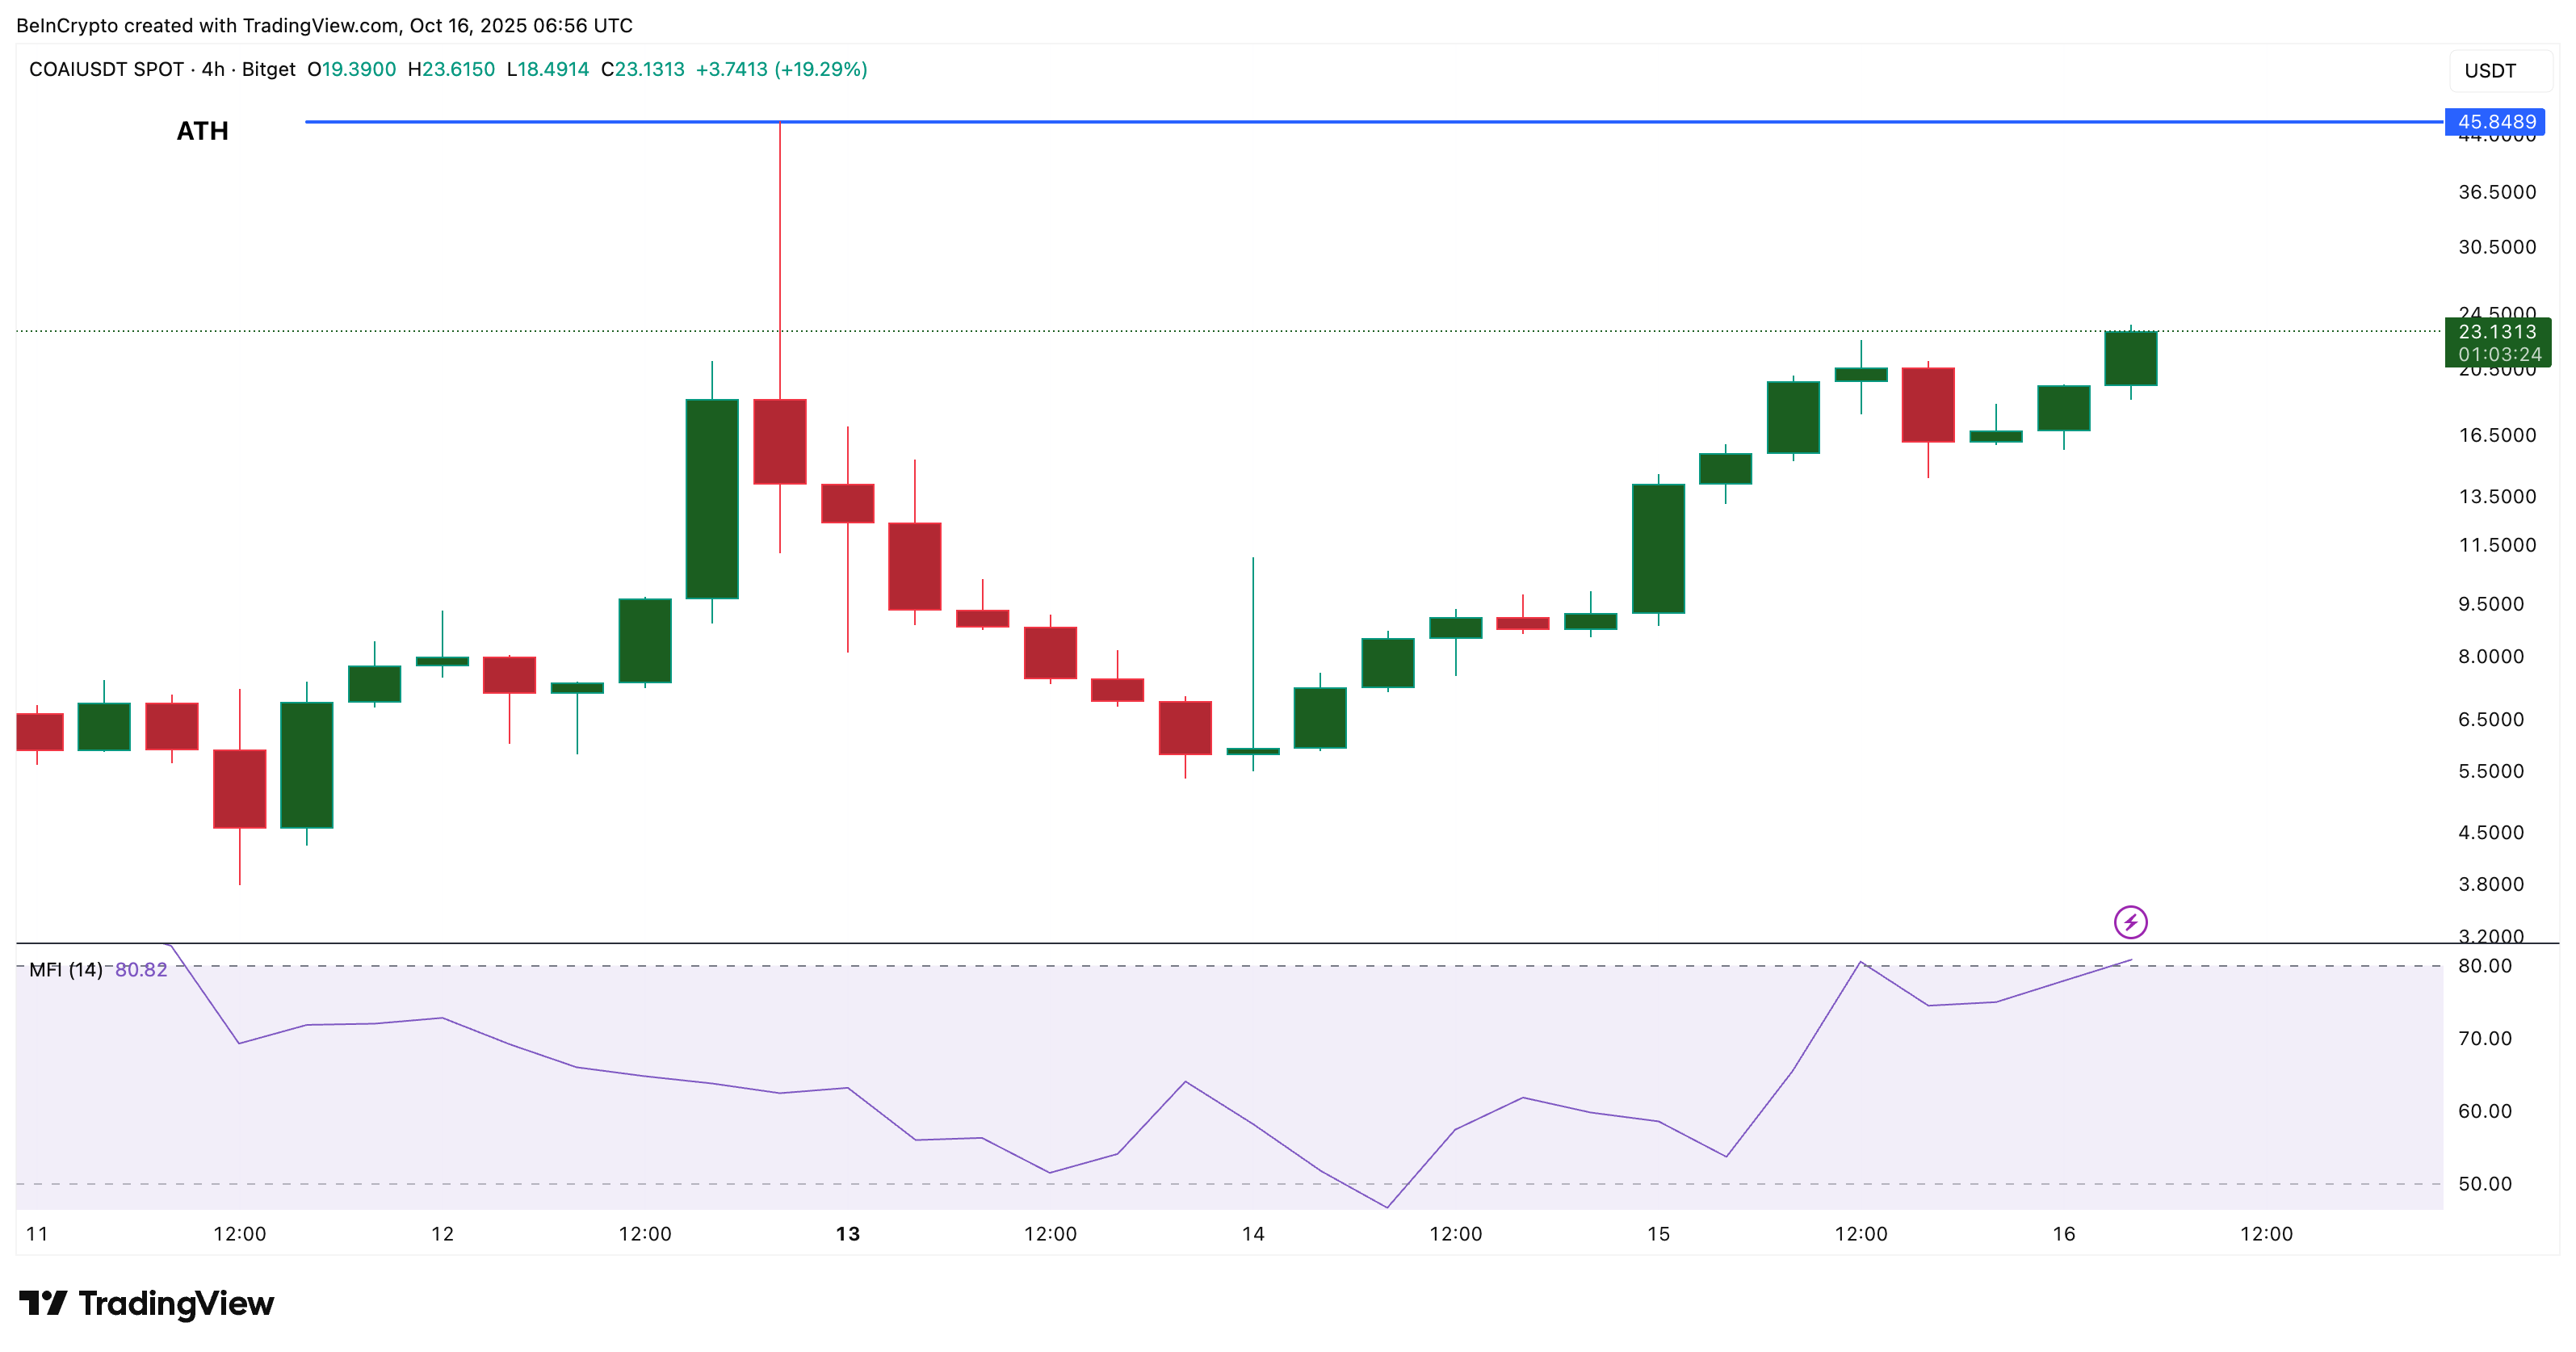 Retail Buying Active But Not Exactly On Dips:
TradingView
Retail Buying Active But Not Exactly On Dips:
TradingView
Meanwhile, the Relative Strength Index (RSI) — which gauges the pace and intensity of price movement — reveals the only key risk. Although COAI’s price made higher highs, RSI has formed a lower high, a bearish divergence that points to slowing momentum.
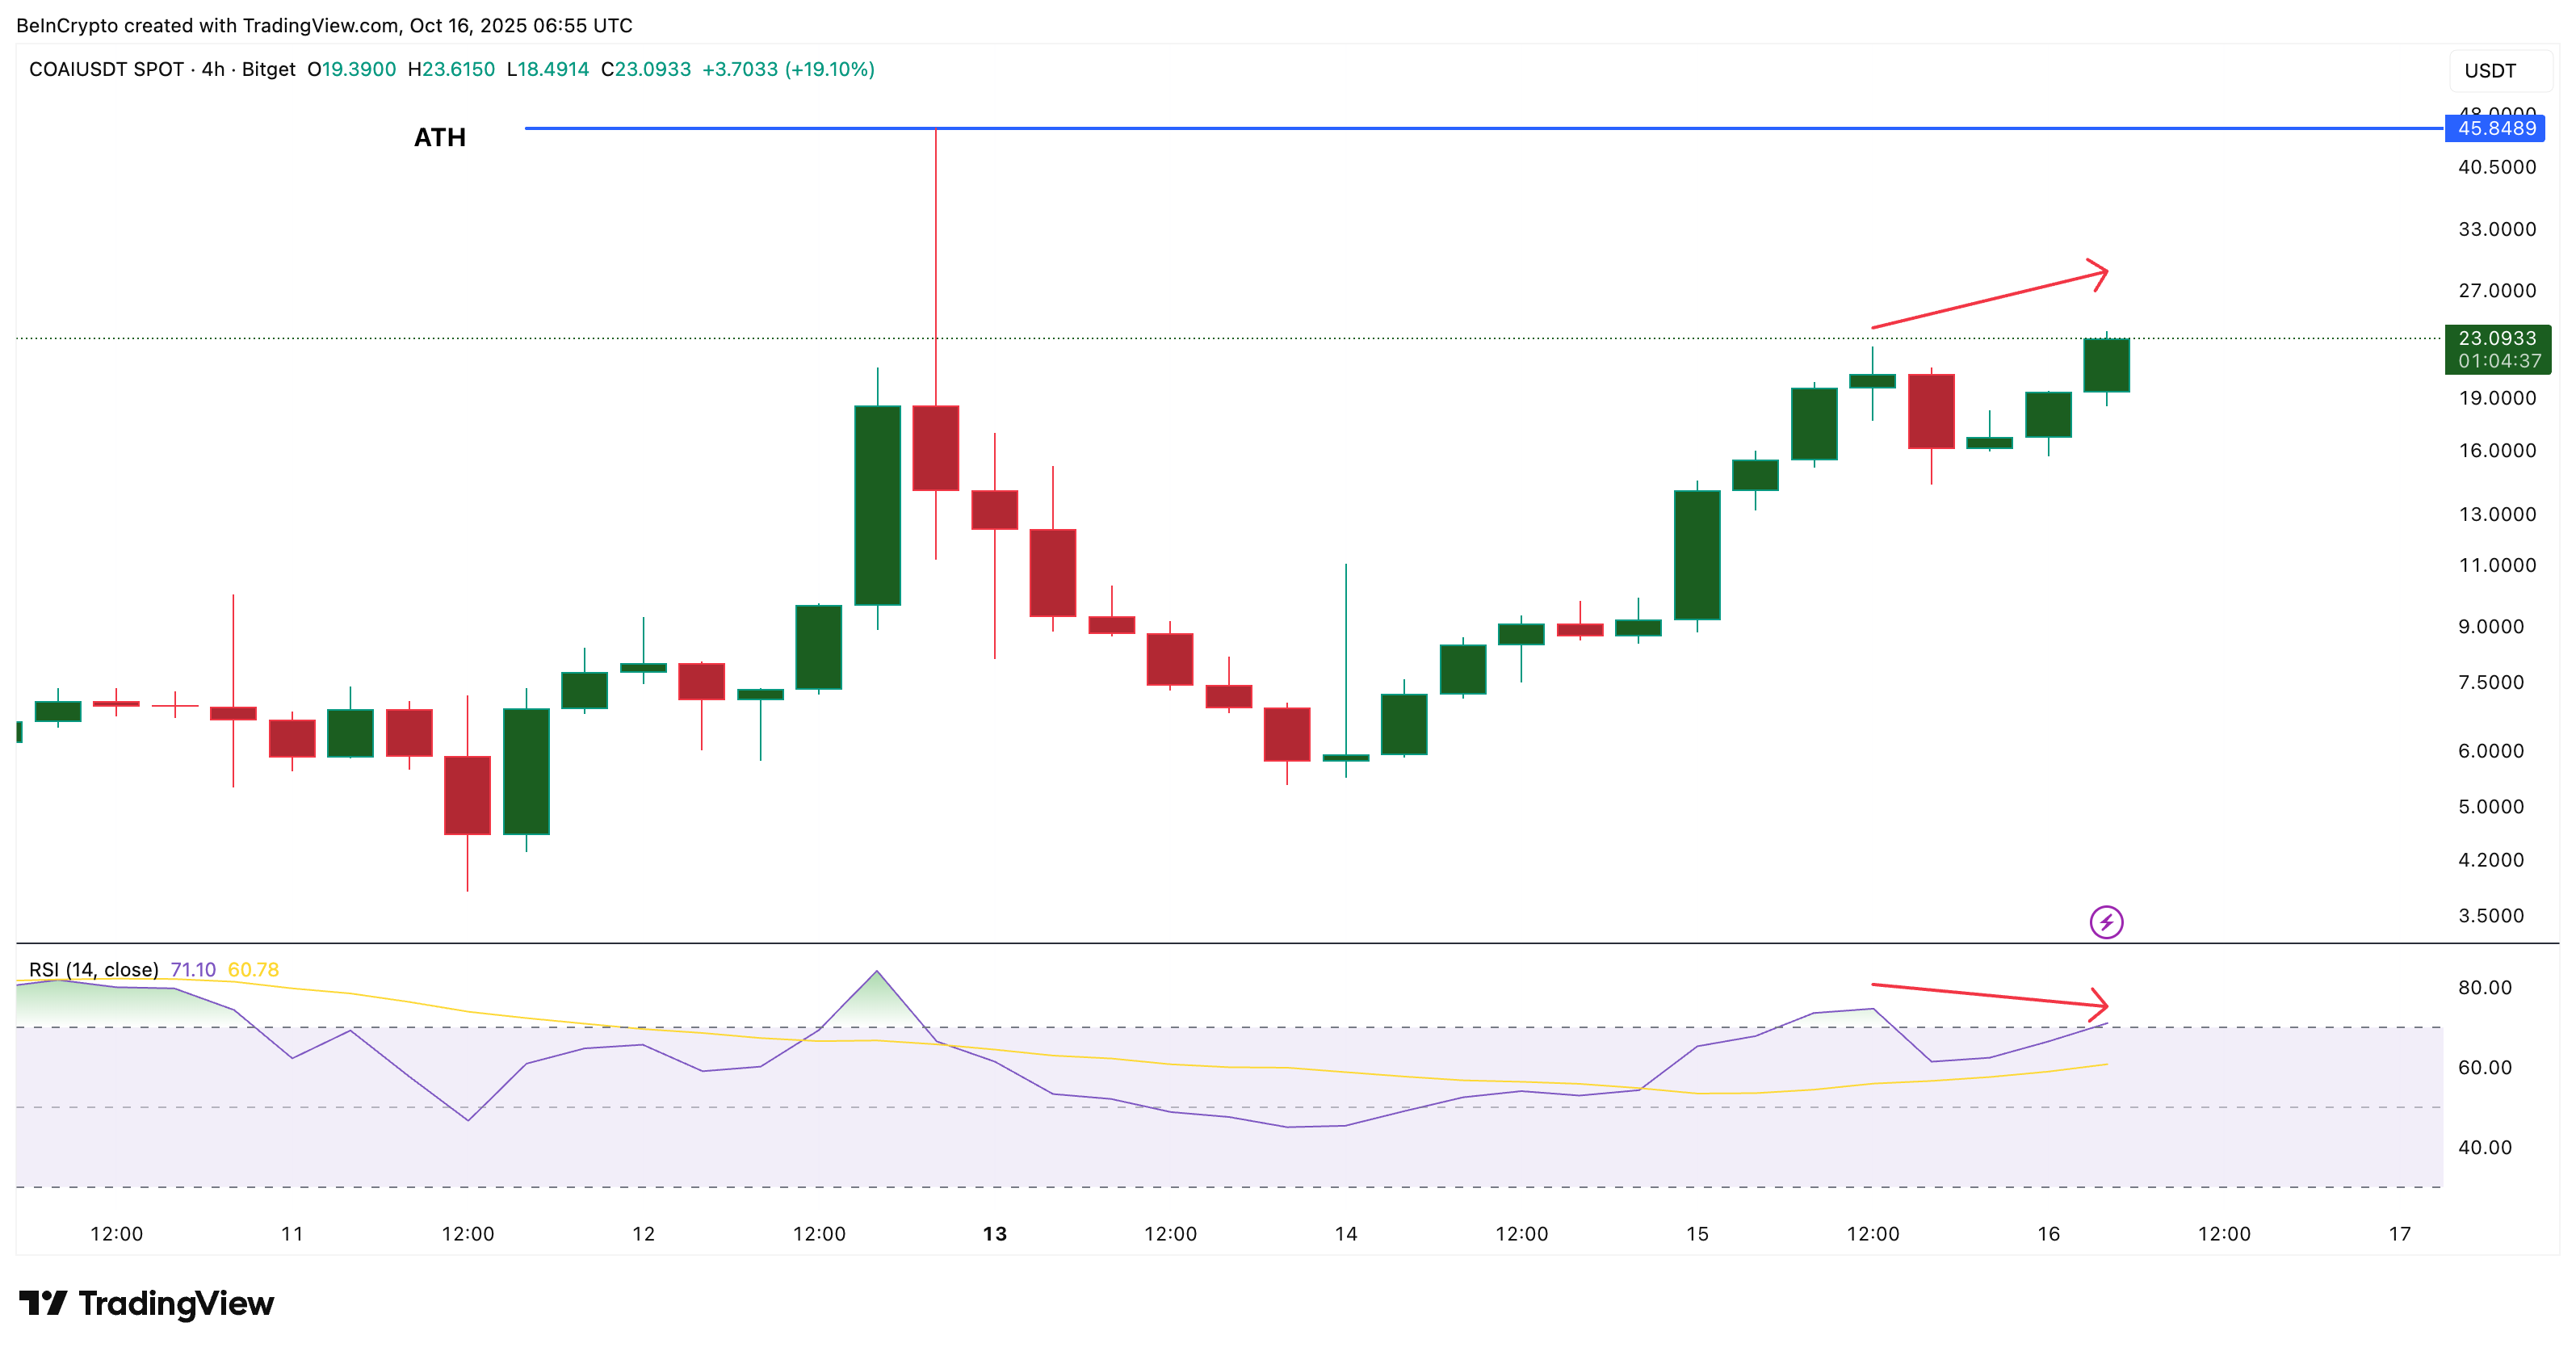 COAI Price Showing Bearish Divergence:
TradingView
COAI Price Showing Bearish Divergence:
TradingView
This may lead to a brief correction before the uptrend resumes. And with MFI not rising during dips, the support levels halting a correction might not be as strong for ChainOpera (COAI).
Key Levels That Could Decide Next COAI Price Move
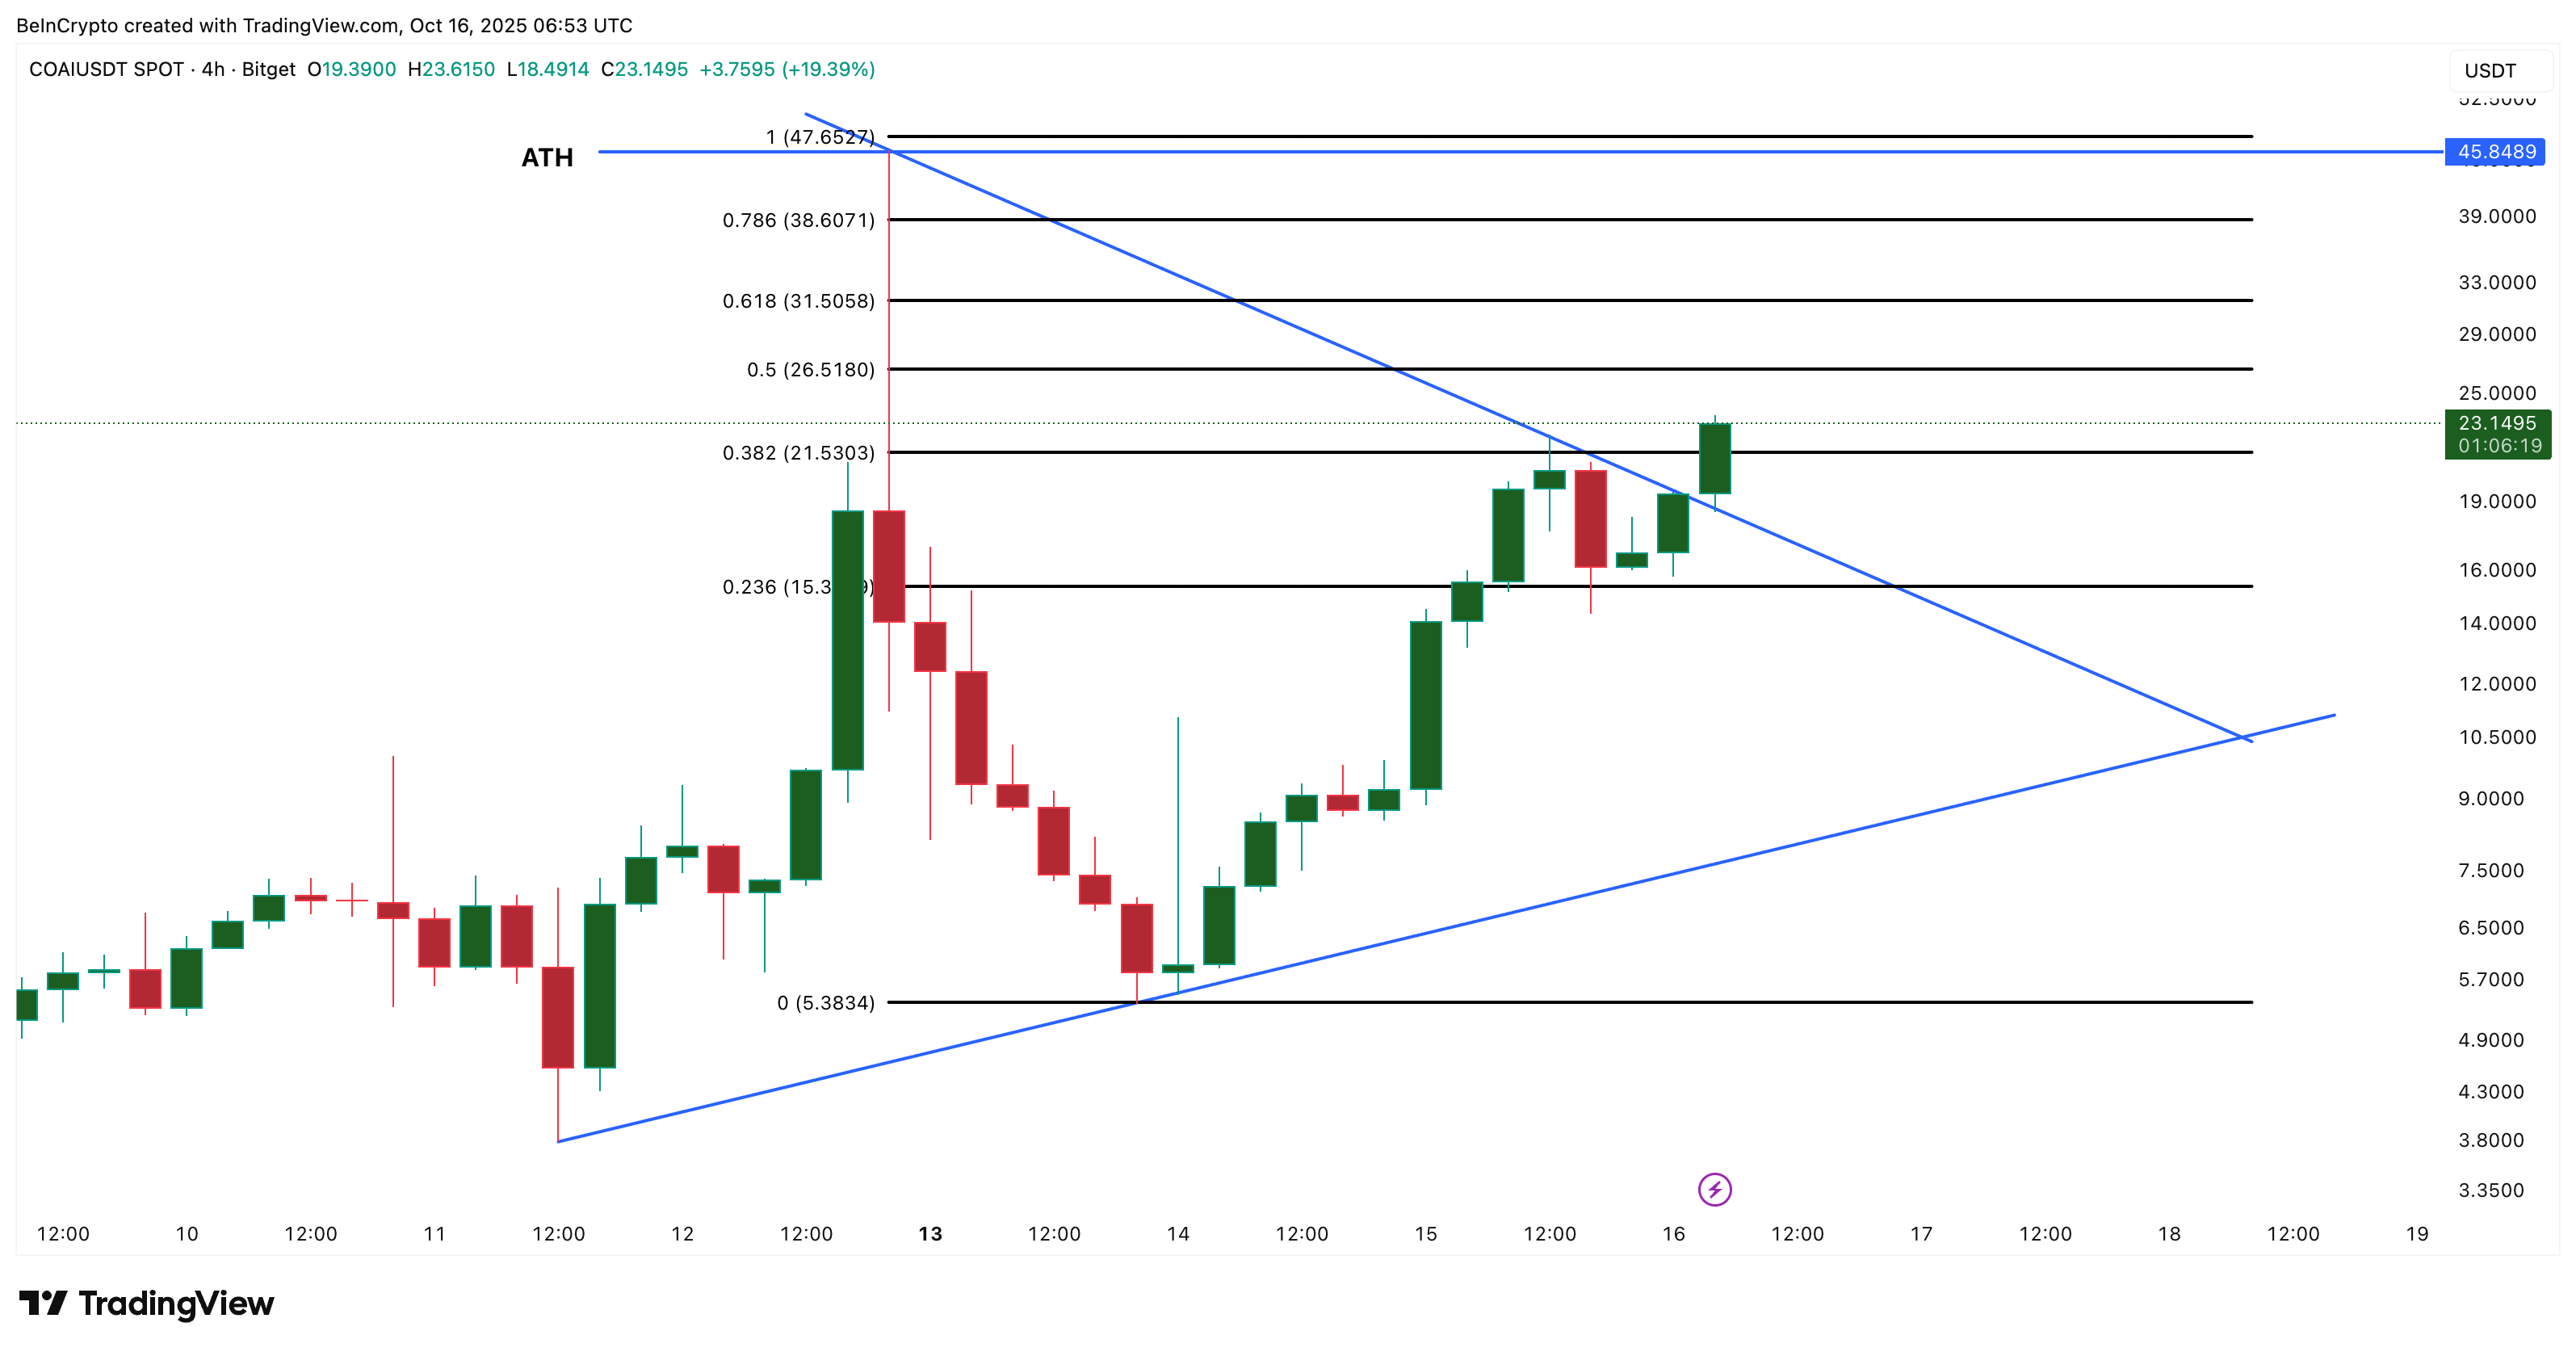
COAI currently trades near $23, right above its breakout zone. The next resistance levels sit at $26, $31, and $38. A daily close above $31 would confirm a continuation pattern, opening the COAI price target path to a retest of the previous all-time high near $45. If that level is breached, COAI could set a new record near $47, per the Fibonacci extension target projection.
 COAI Price Analysis:
TradingView
COAI Price Analysis:
TradingView
However, if RSI weakness triggers a pullback, supports lie near $21 and $15. These levels will decide whether the breakout holds or fails. A rebound from them would suggest buyers still control the structure of this AI-focused token, but a fall below $15 would risk undoing the recent gains.
For now, COAI’s setup remains bullish: the triangle breakout is valid and buying activity is improving. Still, traders should stay alert — the momentum loss shown by RSI could pause the rally before another attempt at new highs.
Disclaimer: The content of this article solely reflects the author's opinion and does not represent the platform in any capacity. This article is not intended to serve as a reference for making investment decisions.
You may also like
Dell executive: "Agent AI" is different this time, key components (mainly memory and HDD) shortages may last for more than 5 years
Dell Technologies Chief Operating Officer Jeff Clarke stated that proxy AI, by taking on more tasks, continues to drive up computing and storage demands, making this AI infrastructure cycle distinct from traditional hardware upgrade cycles. By 2030, data center computing power is expected to increase by 200 GW, inference token generation will grow 87-fold, and infrastructure demand is likely to continue expanding.
Morgan Stanley Backs Meta (META.US): Muse Ecosystem Continues to Expand, VR Glasses Expected to Become a New Growth Point in 2027
Morgan Stanley maintains an "Overweight" rating on Meta with a target price of $775, and continues to list it as a top pick.
Essay: The Next Step in AI Investment—Who Can Turn Computing Power into Profit?
Meta (META.US) surged 36% in September: Muse validates AI strategy, market cap targets $2 trillion
Meta's stock is on track to achieve its best monthly performance since July 2013, and is only about a 1% increase away from joining the $2 trillion market cap club.
Crypto prices
More


