
Ethereum Traders Hit Pause as $5,000 Dream Fades for Now

Ethereum’s $5,000 push has stalled as volatility fades and traders turn cautious. With ETH trading sideways, a breakout could hinge on whether volatility or demand returns to the market.
In the last few sessions, leading altcoin Ethereum has traded flat around the $4,700 mark. This signals waning market momentum as both buyers and sellers ease off activity.
As technical indicators begin to signal a dip in market volatility, ETH could stay locked in a narrow range for now.
Ethereum Price Stuck in a Tight Range as Traders Wait for Volatility to Return
Readings from the ETH/USD one-day chart show that the altcoin has trended within a narrow range over the past three trading sessions. Since Monday, ETH has faced resistance at $4,742 and found support near $4,426.
This sideways trend occurs when market volatility dips, highlighting a relative balance in buying and selling pressure.
The decline in volatility is evident in ETH’s Average True Range (ATR), which has started to fall. At press time, this indicator, which measures the degree of price fluctuation over a set period, is at 176.54.
For token TA and market updates: Want more token insights like this? Sign up for Editor Harsh Notariya’s Daily Crypto Newsletter .
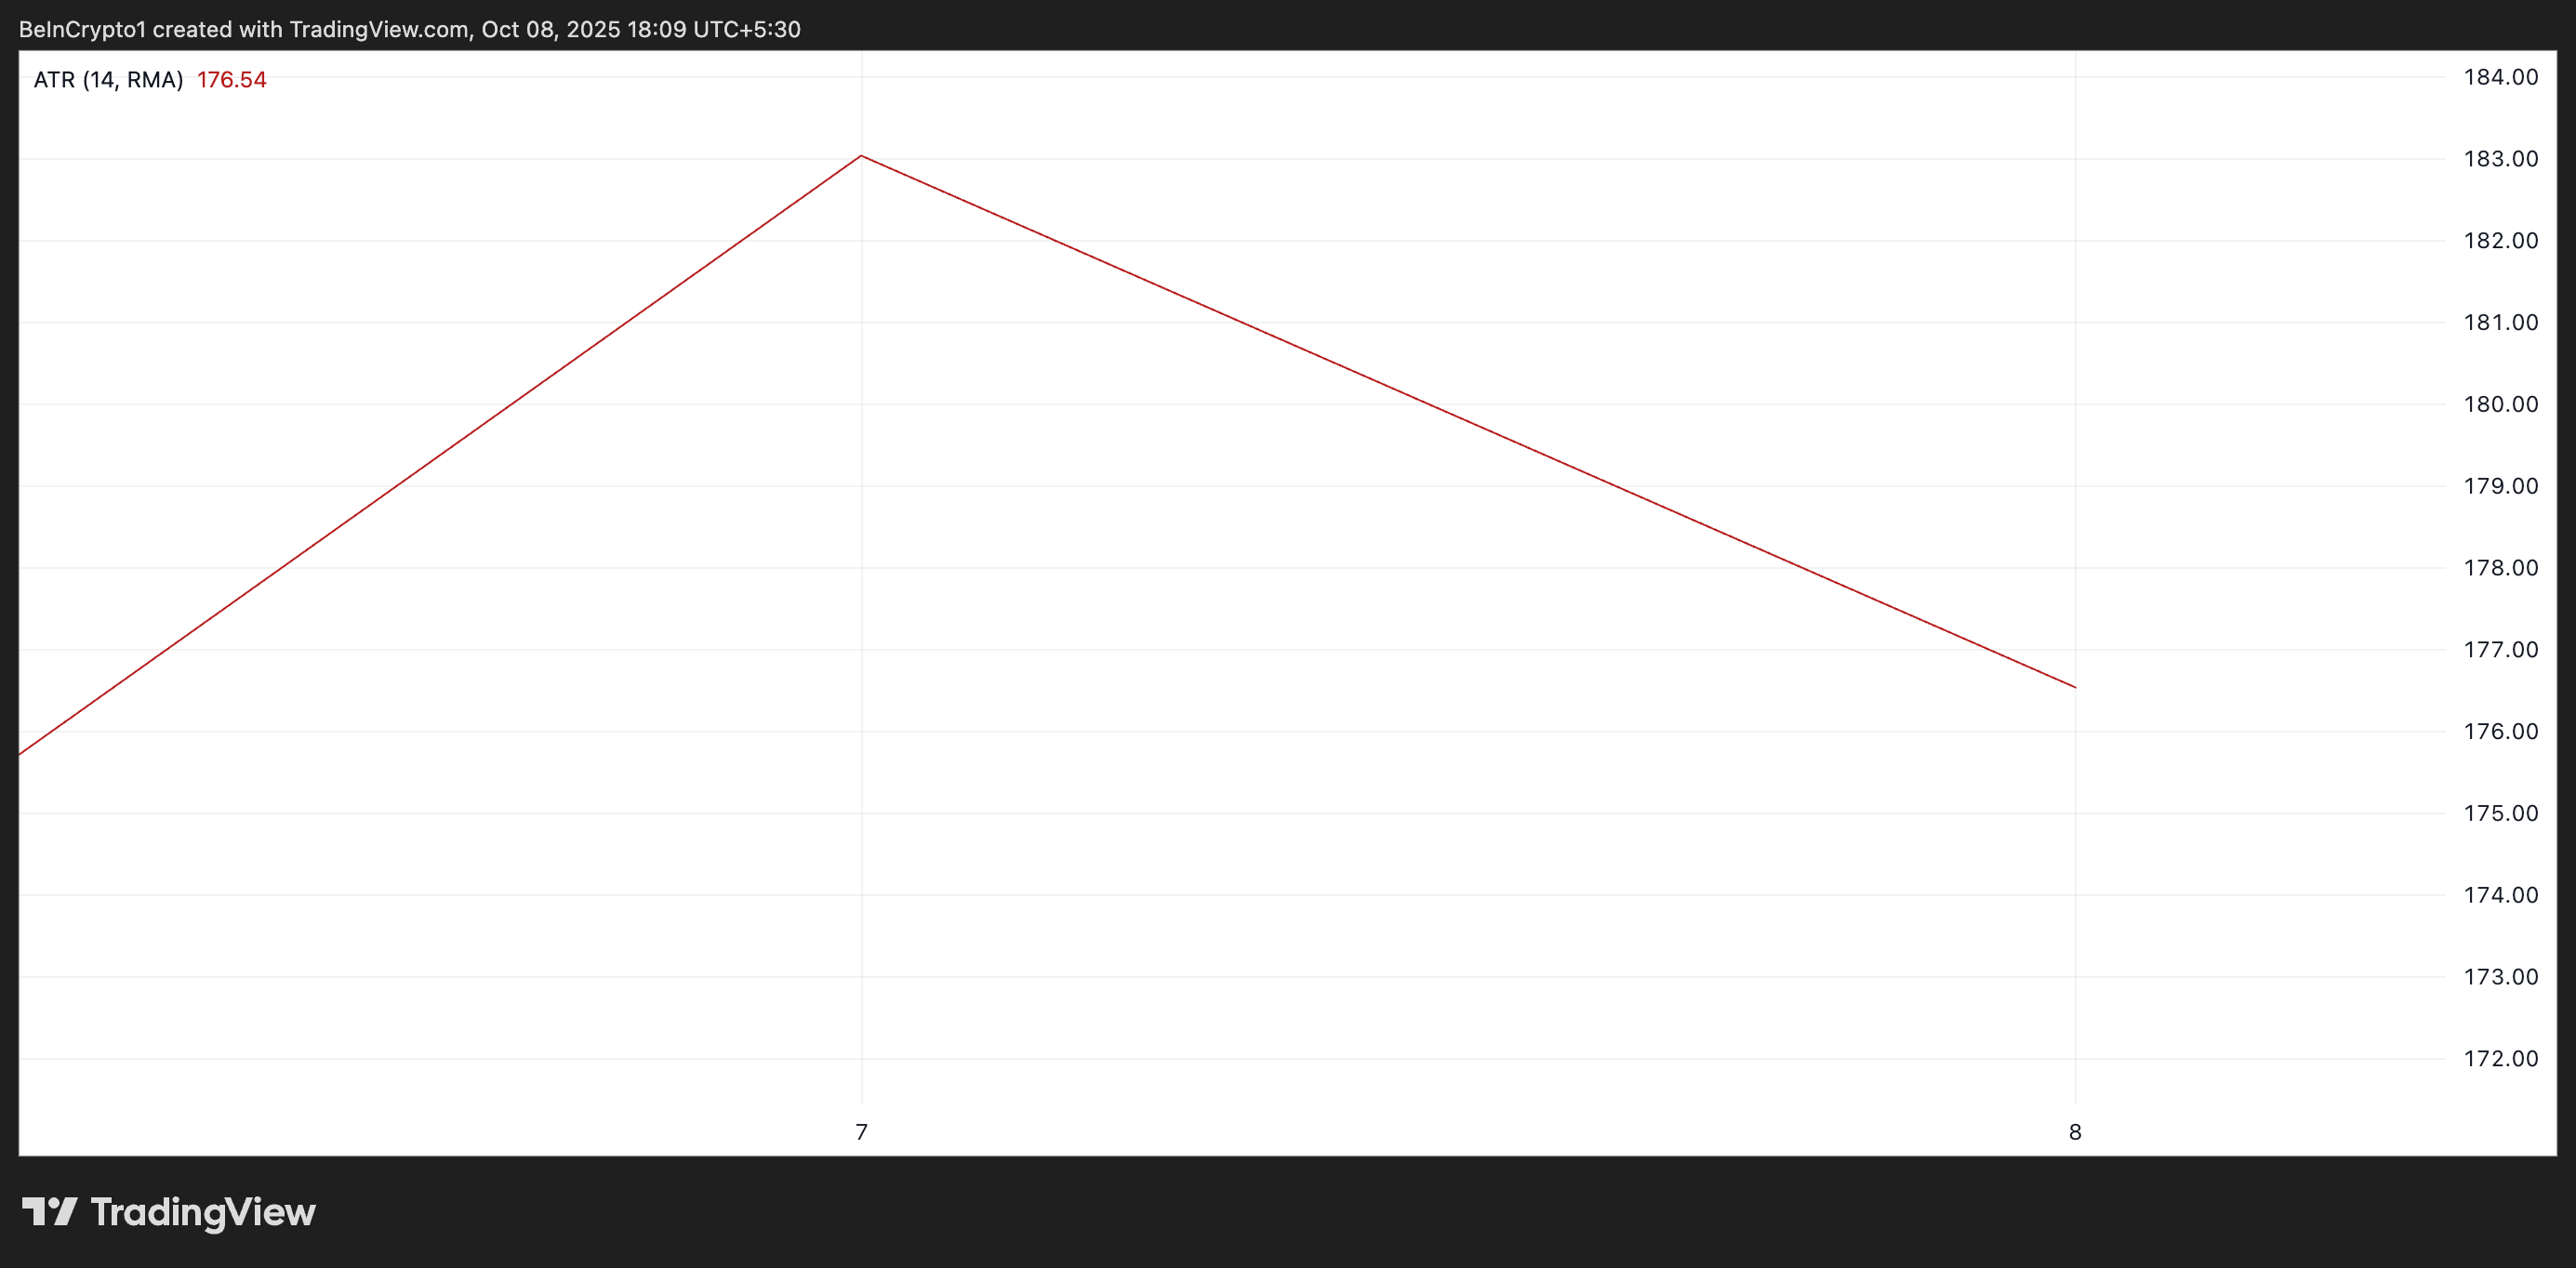 ETH Average True Range. Source:
TradingView
ETH Average True Range. Source:
TradingView
When the ATR falls, it suggests that market participants are becoming more cautious and less willing to take on risk. This results in smaller price swings and lower trading volumes, keeping the asset within a range.
Moreover, ETH’s flattening Relative Strength Index (RSI) confirms this trend. At press time, it stands at 54.07.
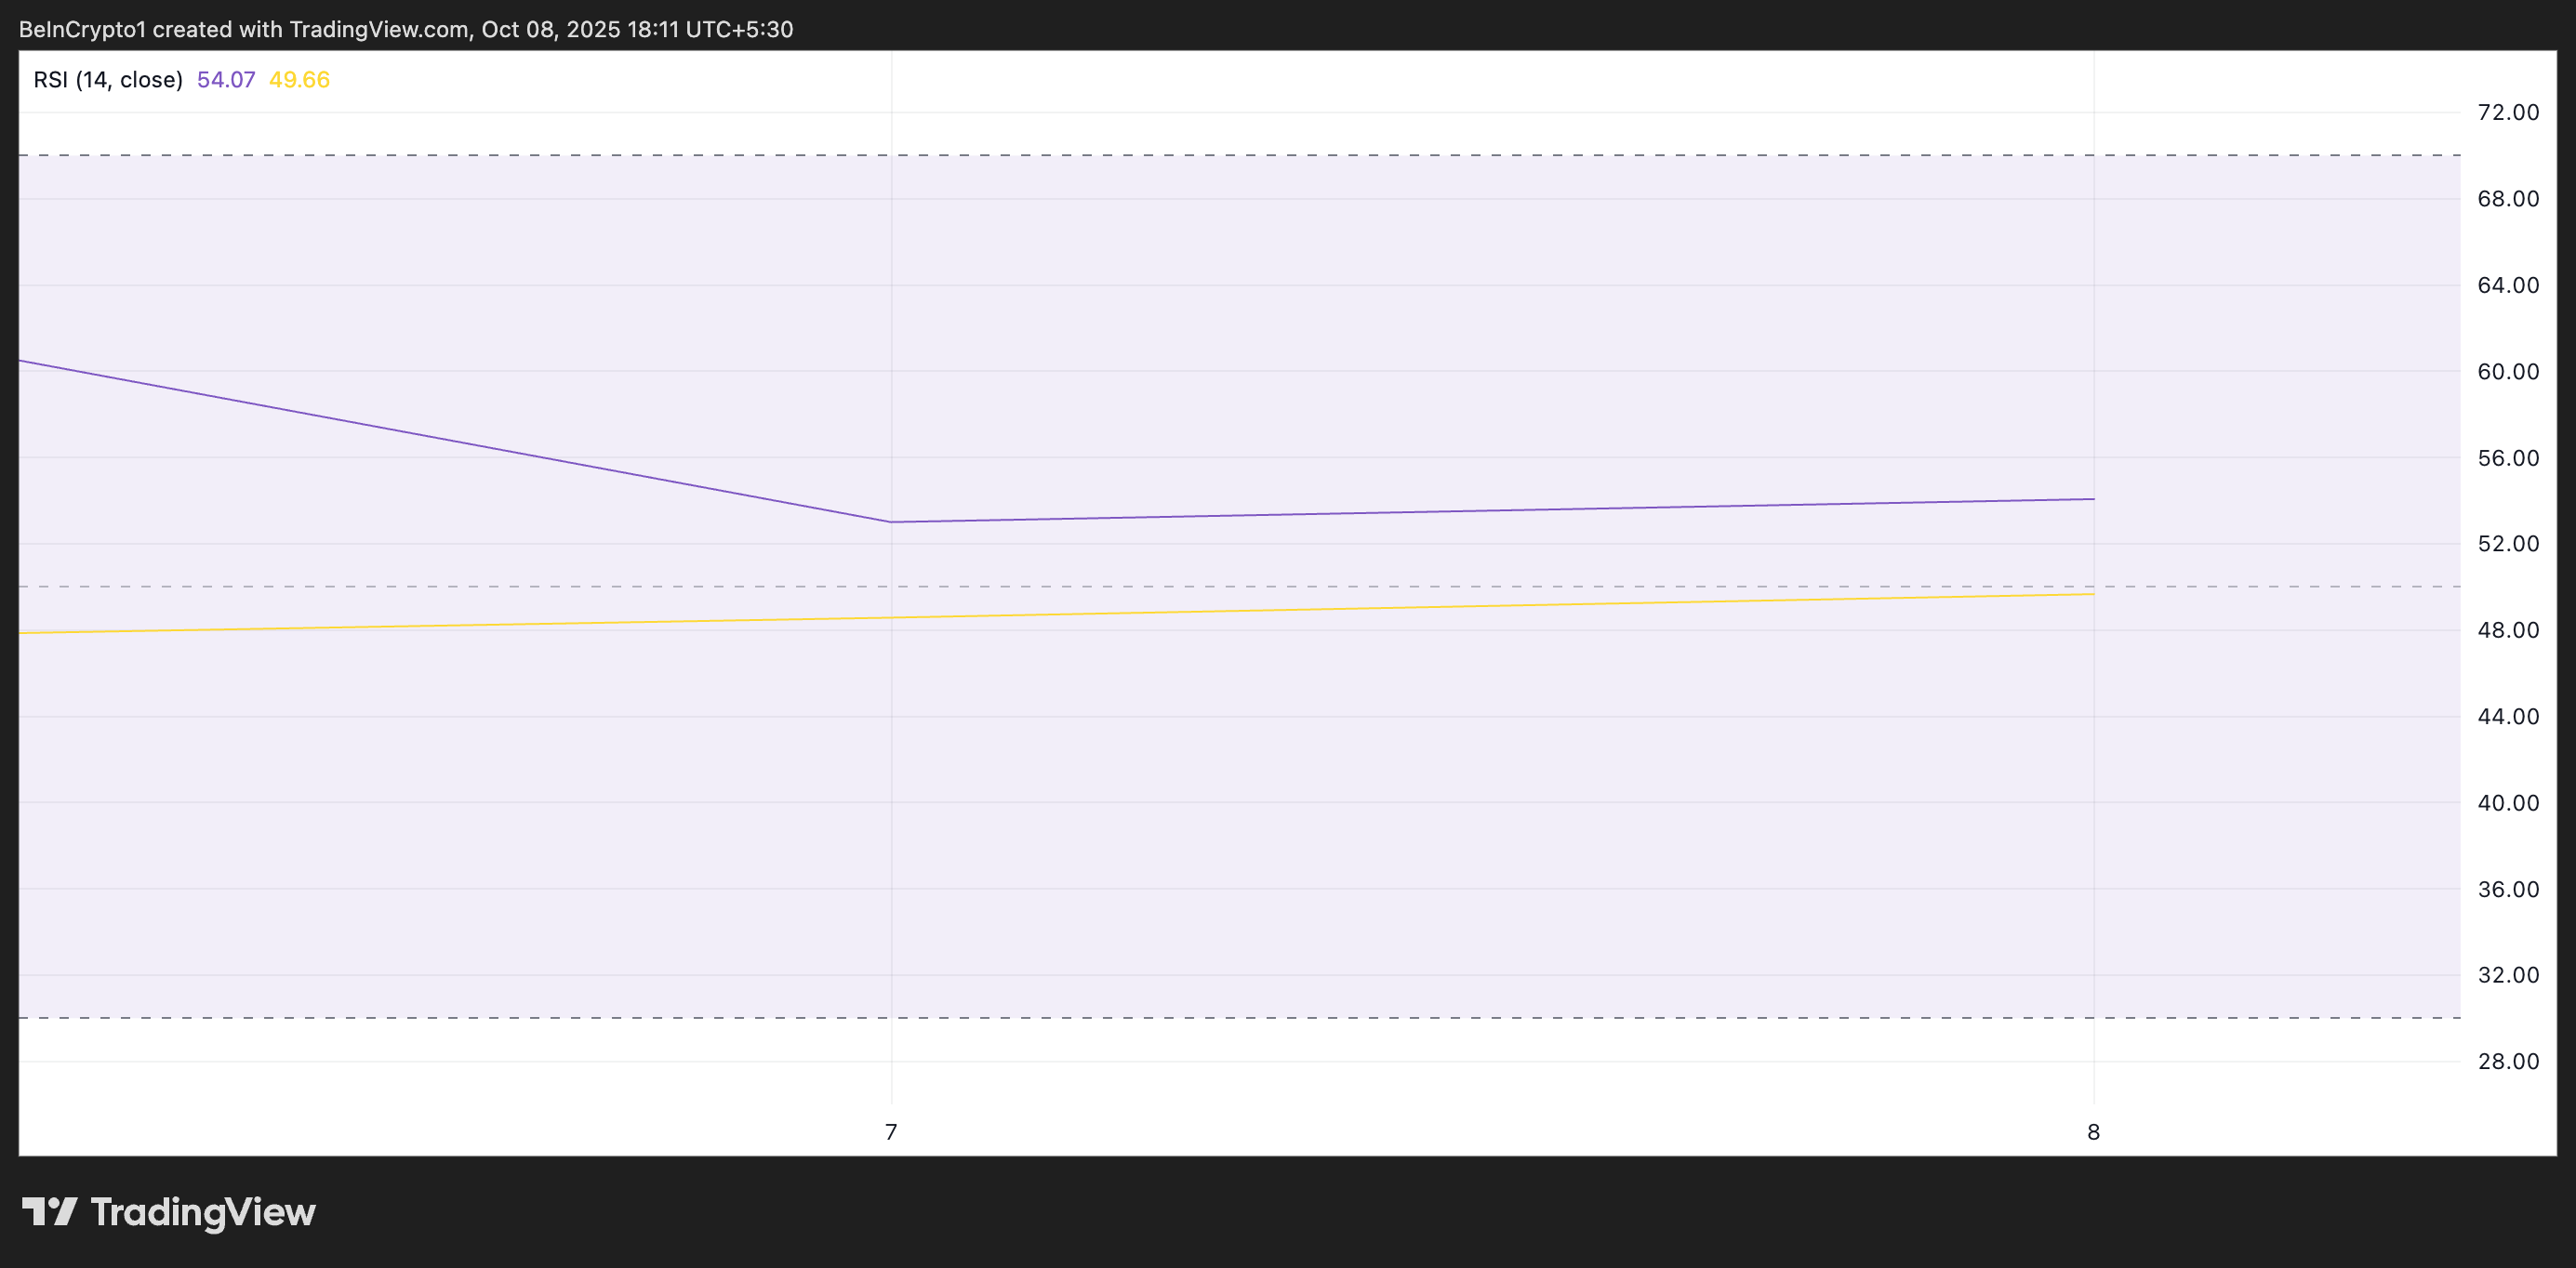 ETH Relative Strength Index. Source:
TradingView
ETH Relative Strength Index. Source:
TradingView
The RSI indicator measures an asset’s overbought and oversold market conditions. It ranges between 0 and 100. Values above 70 suggest that the asset is overbought and due for a price decline, while values under 30 indicate that the asset is oversold and may witness a rebound.
A flat RSI signals a relative balance between buying and selling pressures, highlighting that neither side currently has the upper hand. This balance confirms the low market volatility; if it persists, ETH’s price could remain subdued within its narrow range.
Ethereum Traders on Edge
While periods of low volatility suggest market stability, they signal that traders are less active, which is often a precursor to a sharp breakout in either direction.
Unless volatility regains momentum, ETH could remain range-bound between its current support and resistance zones. If sell-side pressure strengthens, they could trigger a breach of this support floor and a price decline toward $4,211.
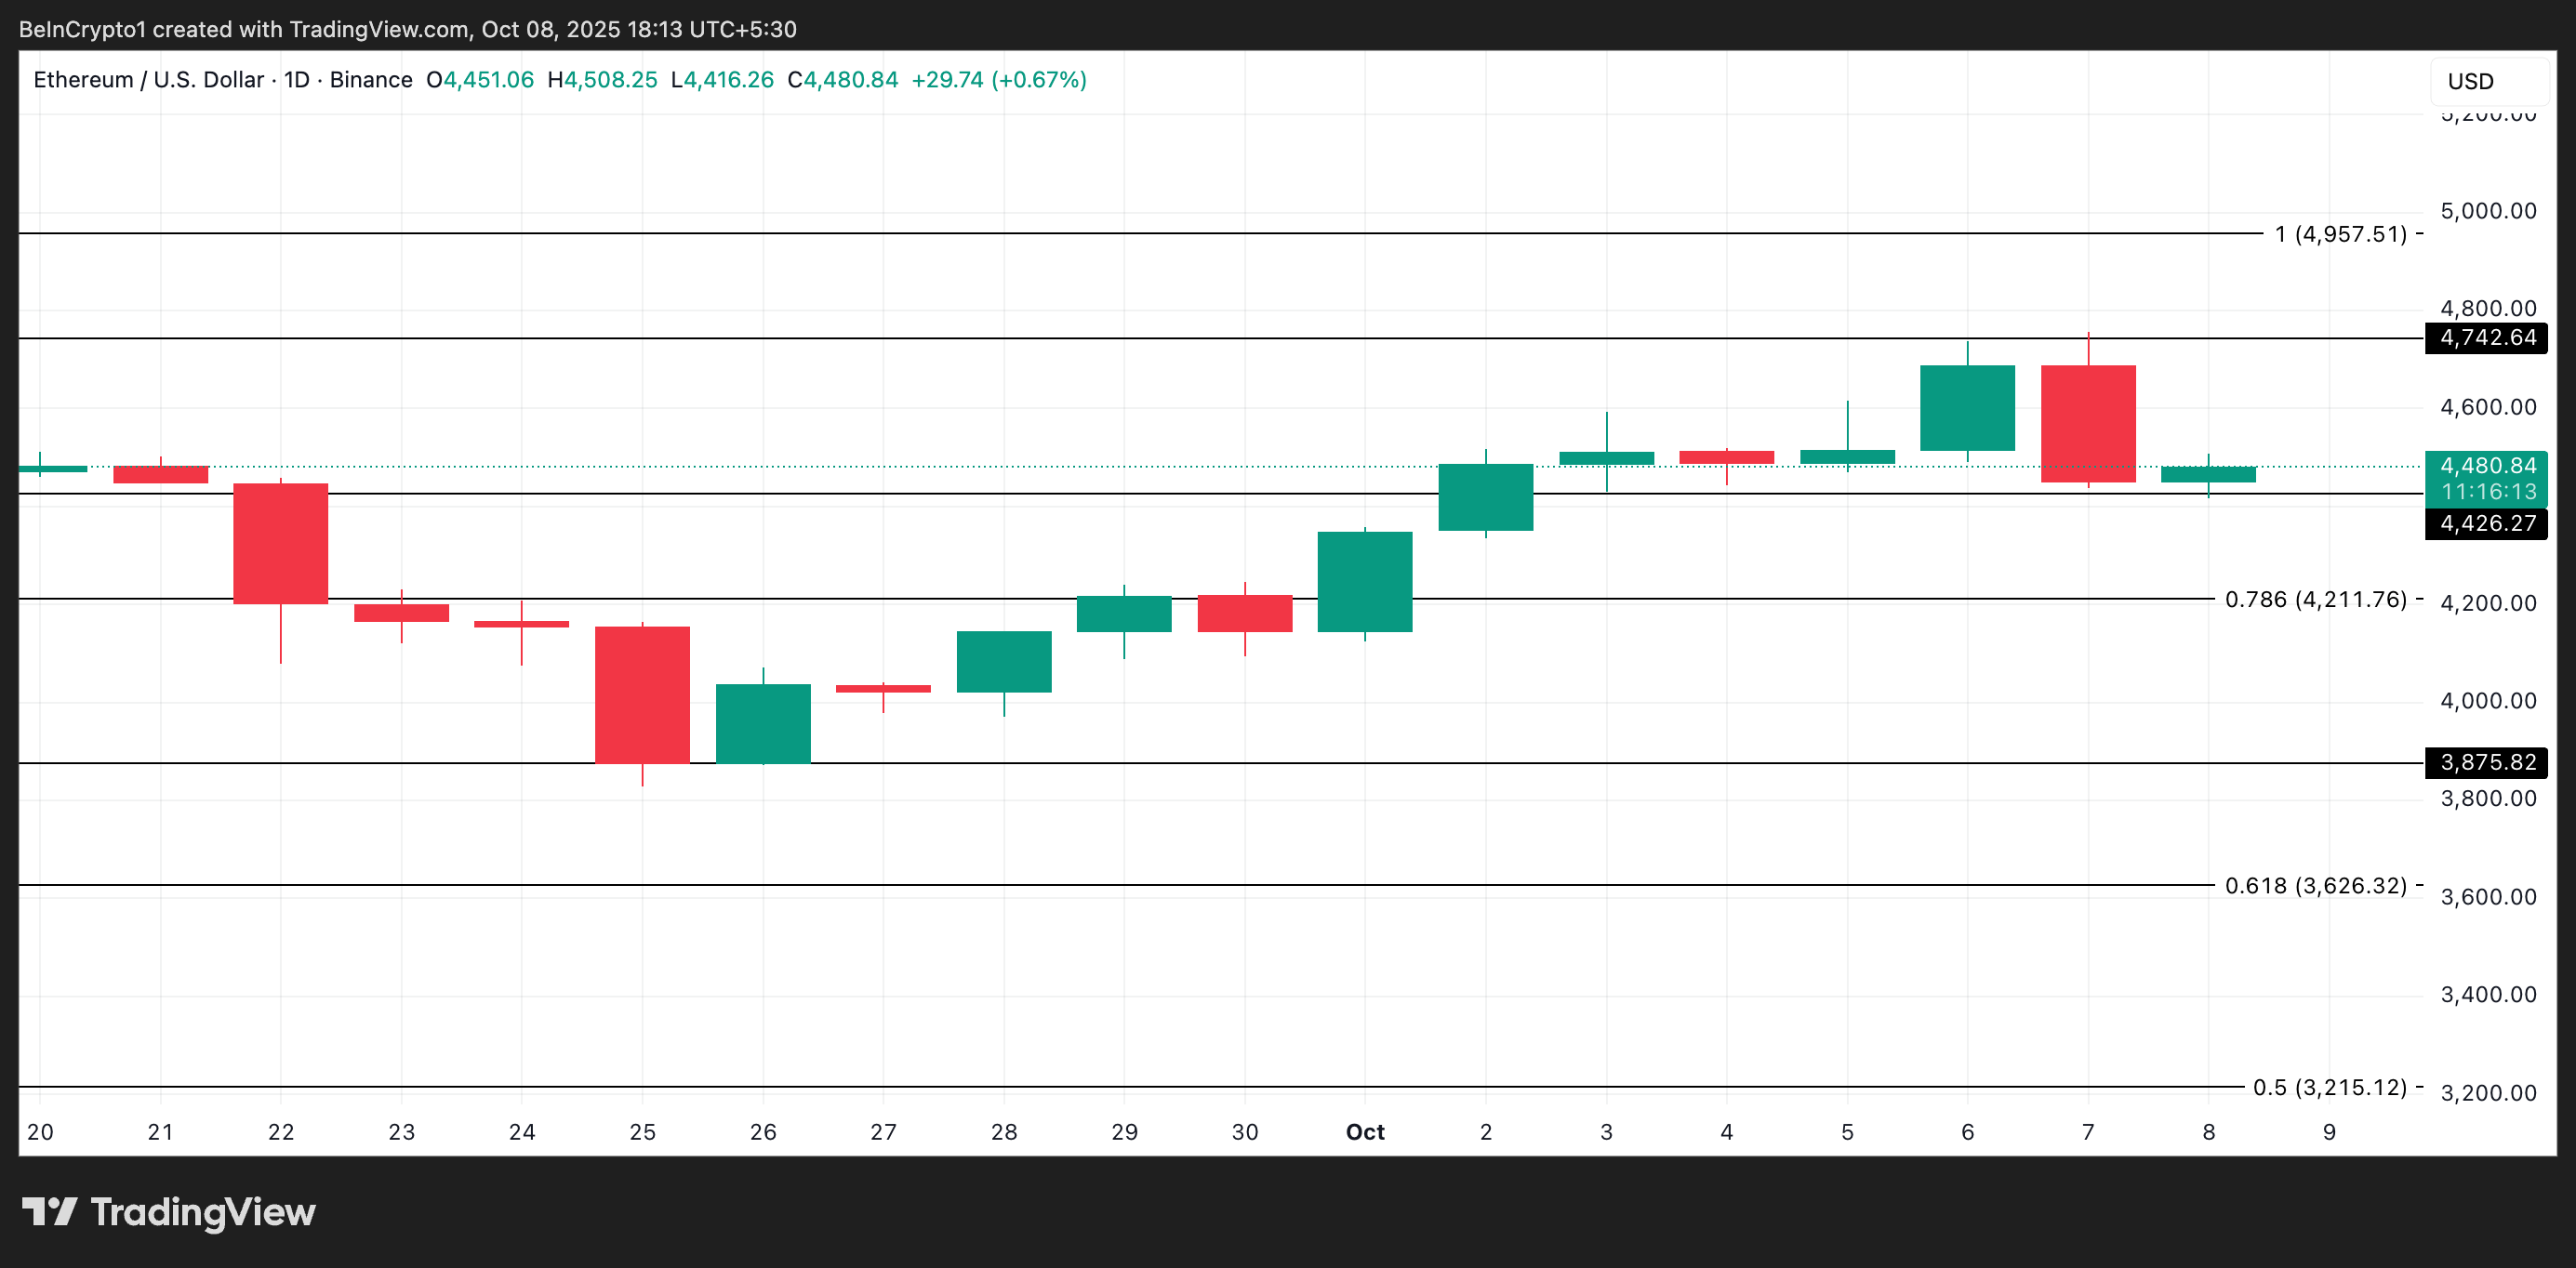 ETH Price Analysis. Source:
TradingView
ETH Price Analysis. Source:
TradingView
On the other hand, if new demand enters the market, this bearish outlook will be invalidated. In that scenario, ETH’s price could break above the resistance at $4,742 and attempt to reclaim its all-time high of $4,957.
Disclaimer: The content of this article solely reflects the author's opinion and does not represent the platform in any capacity. This article is not intended to serve as a reference for making investment decisions.
You may also like
Why suspend RMPs? Explanation from New York Fed SOMA Manager Perli
"Agent vs US Treasury" — Who Will Dominate the US Stock Market?
The wave of AI Agents and US Treasury yields are splitting the US stock market into two worlds: Meta's release of the Muse model boosted its market value by $220 billion in a single week, propelling the Nasdaq's standout performance; however, excluding AI stocks, the S&P 500 actually fell 1% this week, with the number of new lows on the New York Stock Exchange surpassing new highs for nine consecutive days, signaling the near end of "breadth trading." Goldman Sachs bluntly stated that this is a "frustrating cat-and-mouse game" between the stock market and interest rates—any breakout can be snuffed out by the bond market at any time, so equity holders must short US Treasury bonds to hedge simultaneously.
Hopes for a ceasefire between the US and Iran encounter obstacles again! Trump rejects Iran's seven-day proposal; inflation pressure under $100 oil prices remains difficult to ease
Trump rejects a ceasefire with Iran, and it is expected that bombings will occur again after the midterm elections. The president doubts whether Tehran will meet his demands.
Tesla ramps Optimus production 10-fold but robot hands are holding Elon back
Crypto prices
More


