Bitget App
Trade smarter
Buy cryptoMarketsTradeFuturesStocksEarnInstitutionAI & More
Mog Coin (MOG) Retesting Key Breakout – Will It Bounce Back?

Mog Coin (MOG) Retesting Key Breakout – Will It Bounce Back?

CoinsProbeCoinsProbe2025/10/08 18:54
By:Nilesh Hembade

Date: Wed, Oct 08, 2025 | 06:10 PM GMT

The cryptocurrency market is showing signs of recovery today as Bitcoin (BTC) rebounded above $123,500 after dipping to a 24-hour low of $120,600.Also, Ethereum (ETH) turned green with a 1.37% gain, sparking momentum across several memecoins— including Mog Coin (MOG).

Although MOG is slightly down today, its recent price structure reveals a deeper story: the token is now retesting a key breakout level, which could determine whether the next move is another leg up or a short-term correction.

Mog Coin (MOG) Retesting Key Breakout – Will It Bounce Back? image 0 Source: Coinmarketcap

Retesting Falling Wedge Breakout

Over the past several weeks, MOG has been consolidating inside a falling wedge — a well-known bullish reversal pattern that often signals the end of a downtrend. The coin found solid footing near $0.00000061, where buyers began accumulating and pushing prices higher.

This accumulation led to a decisive breakout above the wedge’s resistance line near $0.0000008090, confirming a potential shift in market structure. Following this breakout, MOG surged to a local high of $0.0000009235, where short-term traders took profits, leading to a minor pullback.
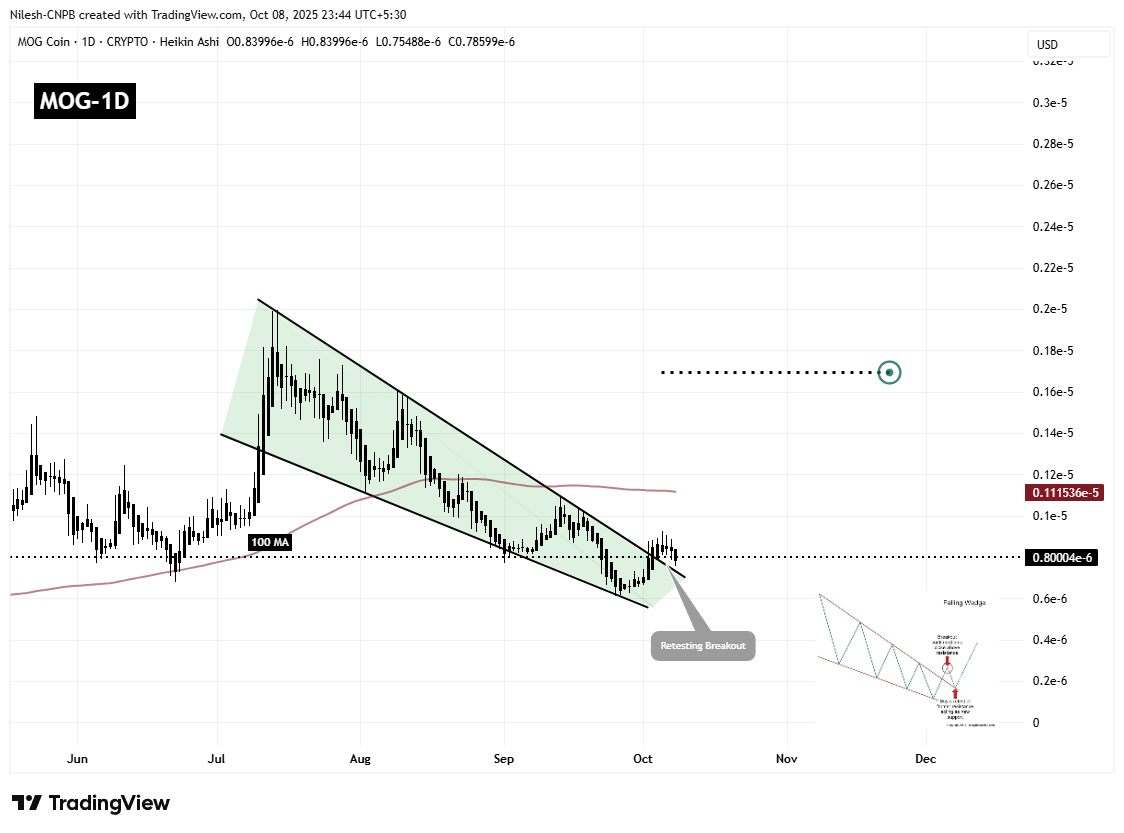
Mog Coin (MOG) Retesting Key Breakout – Will It Bounce Back? image 1 Mog Coin (MOG) Daily Chart/Coinsprobe (Source: Tradingview)

Now, as the chart shows, MOG is retesting the breakout zone around $0.00000075, aligning closely with the former resistance trendline — a level that typically transforms into support after a successful breakout.

What’s Next for MOG?

The current setup looks promising, but the key factor will be whether bulls can defend the breakout area. If buying pressure increases, MOG’s next challenge will be to reclaim the local high of $0.0000009235, followed by breaking above its 100-day moving average (MA) around $0.000001115.

Successfully holding above this zone could open the path toward the next technical target at $0.000001696, implying a potential upside of nearly 100% from current levels.

However, a failure to sustain above the breakout level might send the price back into the wedge, invalidating the breakout and potentially delaying bullish momentum.

0
0

Disclaimer: The content of this article solely reflects the author's opinion and does not represent the platform in any capacity. This article is not intended to serve as a reference for making investment decisions.

Understand the market, then trade.
Bitget offers one-stop trading for cryptocurrencies, stocks, and gold.
Trade now!

You may also like

AI demand drives TSMC to accelerate capacity expansion, 2nm monthly production aims for 120,000 wafers by year-end

According to reports, industry giants such as Apple, Nvidia, and AMD have collectively increased their orders by 10% to 20%, directly boosting TSMC's 2nm monthly production capacity to 120,000 wafers by the end of the year, which exceeds the previous estimate by more than 20% and brings forward the 2027 target by two years. For the first time in history, five factories will ramp up production simultaneously, and the annual compound growth rate of capacity from 2026 to 2028 will reach as high as 70%.

华尔街见闻•2026/09/28 04:26

Long-term US Treasury Sell-off Continues! 10-Year Treasury Yield Breaks 5.2% Again, “AI Boom vs. Rising Financing Costs” Narrative Showdown Intensifies

On Monday, oil prices rose and US Treasury bonds were sold off again as former US President Donald Trump rejected Iran's latest proposal to reopen the Strait of Hormuz, heightening concerns about inflation.

智通财经•2026/09/28 03:16

Banks Have Been Earning Effortlessly from Idle Funds for Years—Will AI Agents Change Everything?

For years, banks have profited from customers' idle funds, but AI agents may be about to change this situation.

智通财经•2026/09/28 03:11

Goldman Sachs: US stocks are showing a "strong index, weak confidence" pattern; catch-up rally may become the main theme of the next phase

Goldman Sachs stated that the current U.S. stock market is showing an unusual pattern: while index performance is strong, investor confidence remains weak. This suggests that the market still has further upside potential, and stocks that previously lagged behind leading AI stocks may soon experience a catch-up rally.

智通财经•2026/09/28 03:06
Goldman Sachs: US stocks are showing a "strong index, weak confidence" pattern; catch-up rally may become the main theme of the next phase