
Ethereum Rainbow Chart predicts ETH price for August 31, 2025

Ethereum’s (ETH) recent rally has cooled, with the asset slipping below the $4,500 mark.
However, the Ethereum Rainbow Chart suggests that higher levels could still be in play by the end of the month for the cryptocurrency.
The chart, which applies logarithmic growth curves to long-term valuation bands, categorizes Ethereum’s price into colored ranges. Notably, the model doesn’t predict short-term moves but helps investors gauge whether the asset is undervalued or overheated.
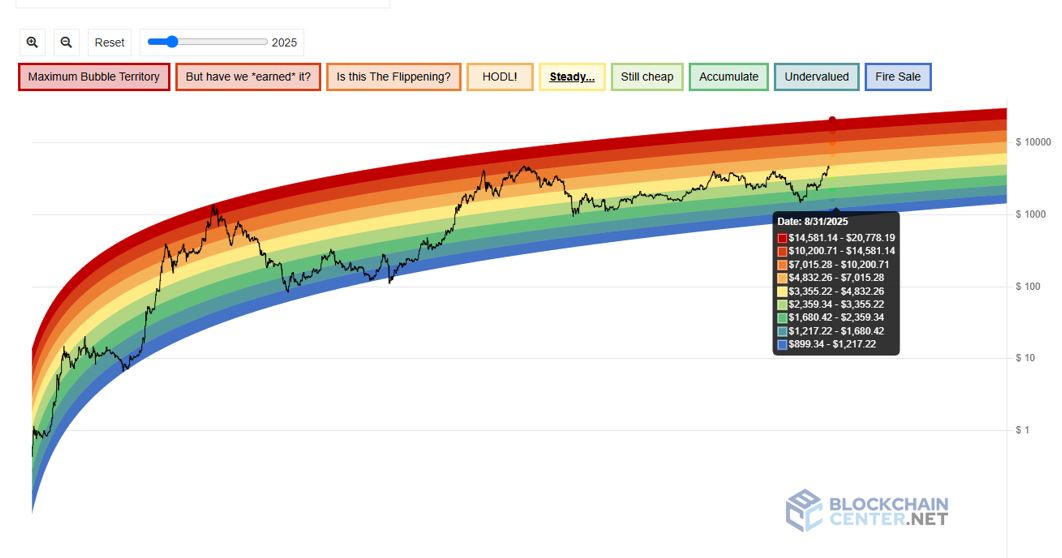
For August 31, 2025, the chart outlines nine possible valuation zones. At the bottom, the ‘Fire Sale’ band spans $899 to $1,217, followed by ‘Undervalued’ ($1,217–$1,680), ‘Accumulate’ ($1,680–$2,359), and ‘Still Cheap’ ($2,359–$3,355). The ‘Steady’ band, often viewed as fair value, ranges from $3,355–$4,832, close to Ethereum’s current trading level.
Above that, ‘HODL!’ covers $4,832–$7,015, ‘Is this The Flippening?’ spans $7,015–$10,200, and ‘But have we earned it?’ runs from $10,200–$14,581. At the very top, ‘Maximum Bubble Territory’ is between $14,581 and $20,778.
With Ethereum trading around $4,400, it sits within the ‘Steady’ zone. If it holds this band into the end of August, the model suggests a likely target between $3,355 and $4,832, indicating historical standards fairly value the asset.
Ethereum price analysis
By press time, Ethereum was priced at $4,442, down 0.15% over the past 24 hours but up 4.5% on the week.
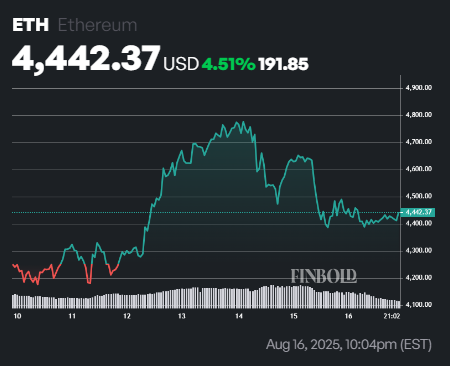
From a technical perspective, the 50-day Simple Moving Average (SMA) of $3,413.61 and the 200-day SMA of $2,596.84 remain well below current price levels, confirming strong upward momentum and a sustained bullish trend.
Meanwhile, the 14-day Relative Strength Index (RSI) at 66.86 signals strong buying pressure, nearing the overbought threshold of 70. This suggests further gains are possible for Ethereum, though momentum may cool or face minor corrections if buying becomes excessive.
Featured image via Shutterstock
Disclaimer: The content of this article solely reflects the author's opinion and does not represent the platform in any capacity. This article is not intended to serve as a reference for making investment decisions.
You may also like
Federal Reserve approves stress test reform by a 6-1 vote: Capital requirement volatility halved, sole dissenting vote warns of reduced resilience
The Federal Reserve has officially approved two final rules aimed at increasing transparency and reducing capital requirement volatility by approximately 50%. The new regulations will seek public comments on stress test scenarios and will calculate the capital buffer based on the average of the results from two consecutive years of testing. This averaging mechanism will take effect in 2028. The reforms are the result of years of negotiation within the banking sector and have been welcomed by industry groups. However, critics such as Governor Barr warn that the reforms will weaken the constraints of stress testing and reduce the overall resilience of the banking system.

Metals fade as long yields offset cooler inflation, lower Fed odds - Kitco PM Report
Bitwise brings NEAR to Wall Street – But the chart isn’t impressed
Synopsys and OpenAI reach AI chip design partnership, stock price surges over 7%
Synopsys has signed a multi-year legally binding agreement with OpenAI to jointly develop GPT-Synopsys, a model specifically trained and fine-tuned for chip design tasks. OpenAI will pay Synopsys a subscription fee for tool licensing, and both parties will share revenue based on improvements in chip design achieved by customers using the product.
Crypto prices
More


